 16
16peptides
spectra
0.000 | 0.000
0.000 | 0.000
0.000 | 0.000
0.000 | 0.001
0.000 | 0.033
0.048 | 0.087
0.837 | 0.848
0.063 | 0.076
| Plot | Mito | Lyso | Perox | ER | Golgi | PM | Cytosol | Nucleus | |||||
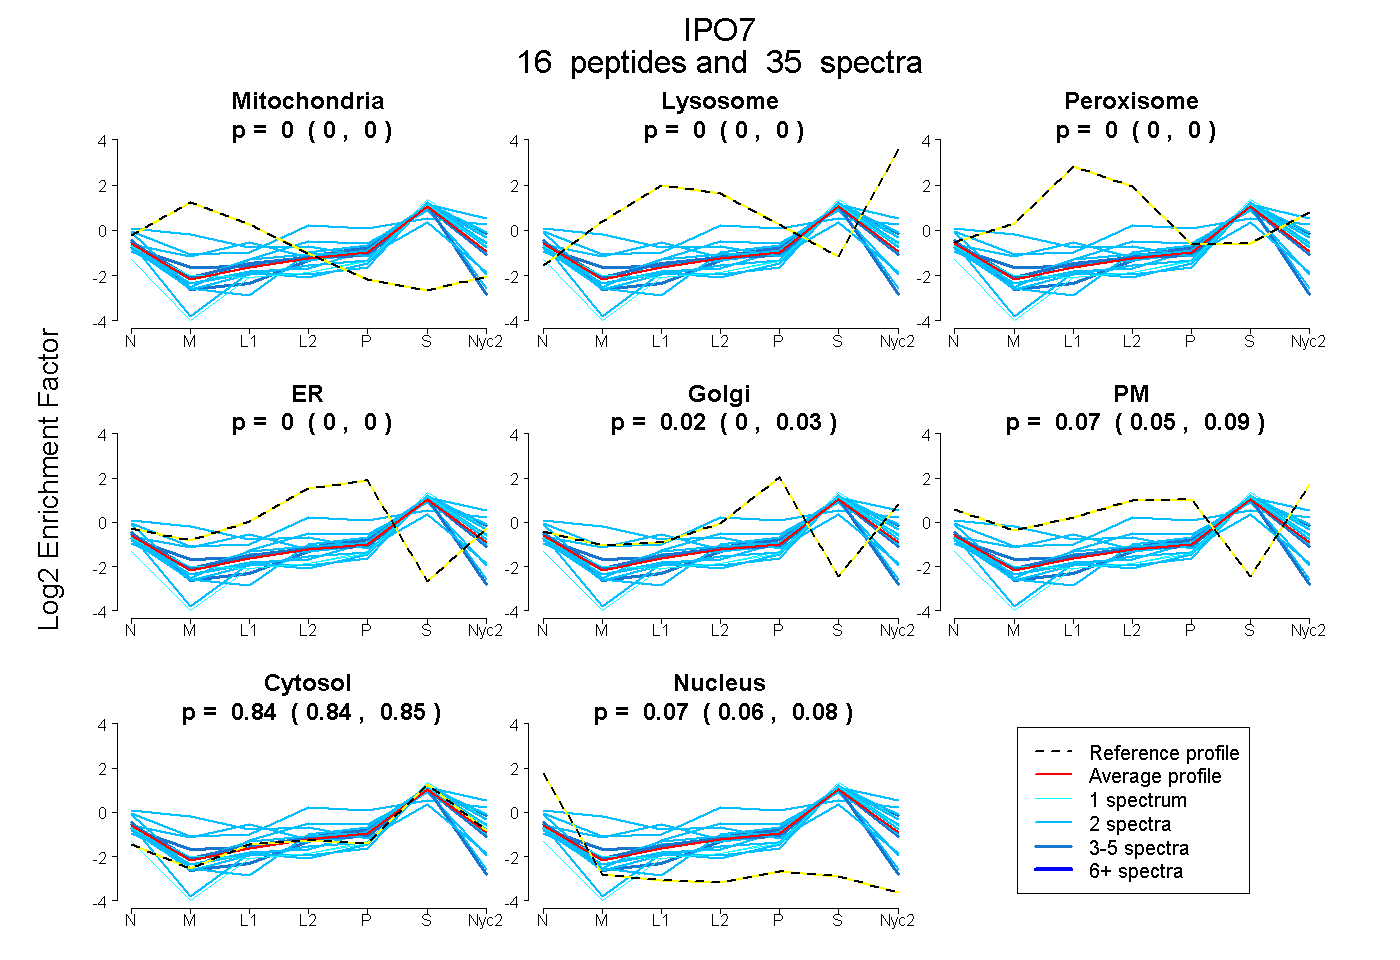
| Expt A |
16 peptides |
35 spectra |
|
0.000 0.000 | 0.000 |
0.000 0.000 | 0.000 |
0.000 0.000 | 0.000 |
0.000 0.000 | 0.001 |
0.017 0.000 | 0.033 |
0.070 0.048 | 0.087 |
0.843 0.837 | 0.848 |
0.070 0.063 | 0.076 |
| 2 spectra, HDYPSR | 0.000 | 0.000 | 0.044 | 0.000 | 0.000 | 0.412 | 0.544 | 0.000 | ||
| 2 spectra, SDQNLQTALELTR | 0.000 | 0.000 | 0.000 | 0.000 | 0.000 | 0.000 | 0.901 | 0.099 | ||
| 3 spectra, AFAVGVQQVLLK | 0.000 | 0.000 | 0.000 | 0.000 | 0.122 | 0.000 | 0.828 | 0.050 | ||
| 5 spectra, VQLTTCIHHIIK | 0.058 | 0.000 | 0.000 | 0.006 | 0.000 | 0.000 | 0.767 | 0.170 | ||
| 2 spectra, EYNEFAEVFLK | 0.000 | 0.000 | 0.000 | 0.000 | 0.000 | 0.000 | 0.893 | 0.107 | ||
| 2 spectra, GTMDPALR | 0.107 | 0.000 | 0.127 | 0.000 | 0.000 | 0.054 | 0.712 | 0.000 | ||
| 1 spectrum, YGSPGNVSK | 0.000 | 0.000 | 0.000 | 0.000 | 0.004 | 0.011 | 0.891 | 0.094 | ||
| 2 spectra, NMITQYWPDR | 0.000 | 0.021 | 0.000 | 0.000 | 0.000 | 0.093 | 0.886 | 0.000 | ||
| 2 spectra, WTAIVDK | 0.000 | 0.000 | 0.000 | 0.000 | 0.000 | 0.000 | 0.897 | 0.103 | ||
| 2 spectra, WALHILAR | 0.384 | 0.000 | 0.074 | 0.018 | 0.000 | 0.000 | 0.496 | 0.028 | ||
| 3 spectra, AIFQTIQNR | 0.061 | 0.000 | 0.000 | 0.018 | 0.088 | 0.000 | 0.810 | 0.023 | ||
| 2 spectra, VLYQYK | 0.000 | 0.000 | 0.000 | 0.000 | 0.090 | 0.000 | 0.881 | 0.029 | ||
| 2 spectra, QLNEAHK | 0.000 | 0.083 | 0.000 | 0.000 | 0.000 | 0.103 | 0.815 | 0.000 | ||
| 1 spectrum, ETENDDLTNVIQK | 0.000 | 0.000 | 0.000 | 0.000 | 0.000 | 0.000 | 0.982 | 0.018 | ||
| 2 spectra, ENIVEAIIHSPELIR | 0.000 | 0.000 | 0.000 | 0.003 | 0.000 | 0.000 | 0.804 | 0.193 | ||
| 2 spectra, QAGVIYLK | 0.000 | 0.000 | 0.000 | 0.165 | 0.000 | 0.000 | 0.716 | 0.118 |
| Plot | Mito | Lyso or Perox | ER | Golgi | PM | Cytosol | Nucleus | ||||||
| Expt B |
5 peptides |
11 spectra |
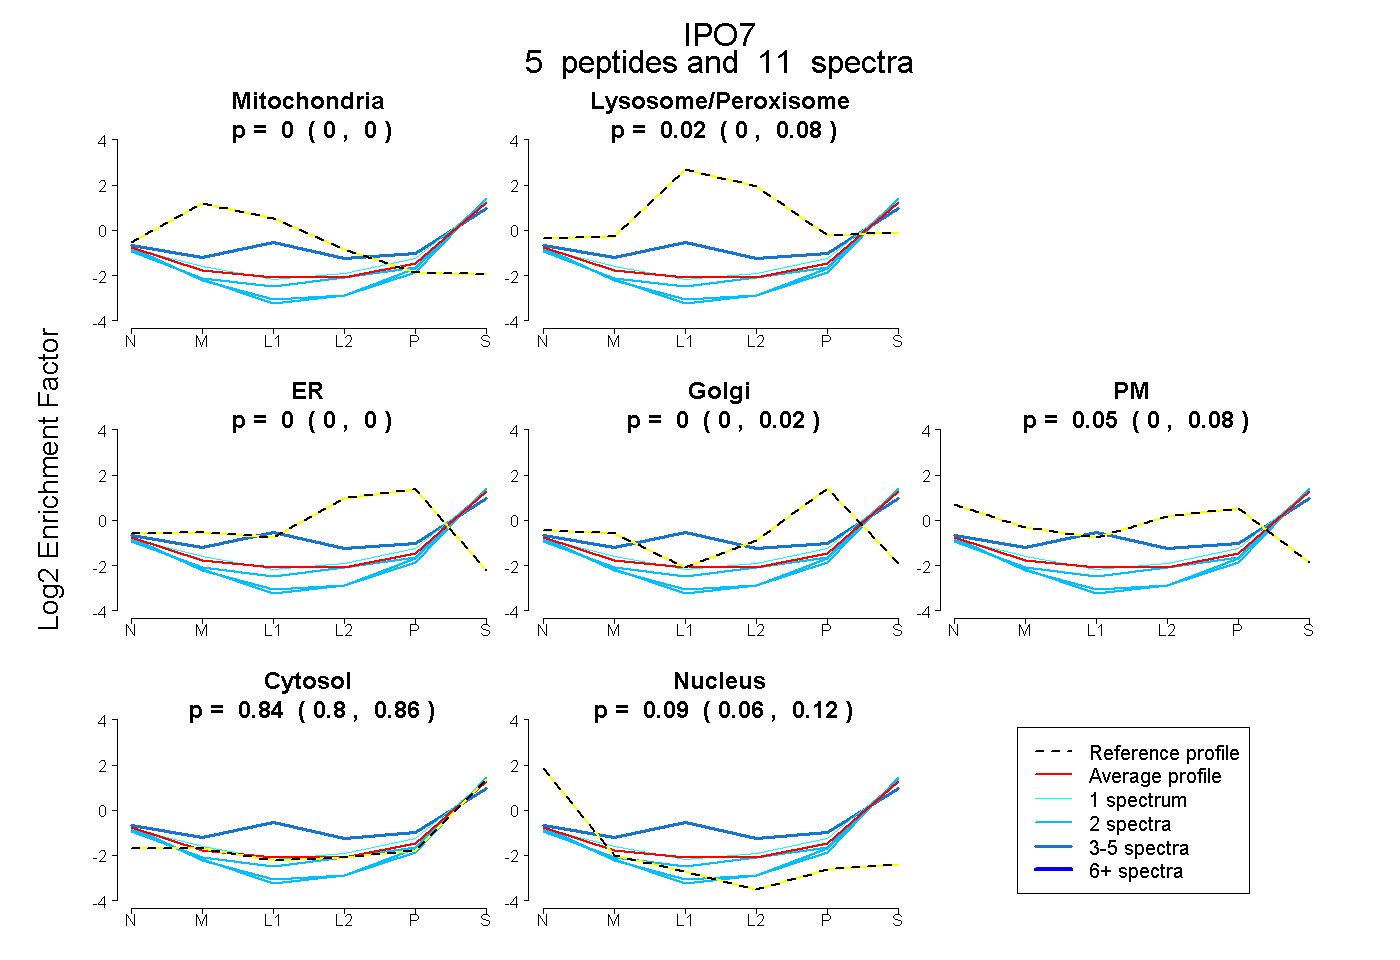 |
0.000 0.000 | 0.000 |
0.017 0.000 | 0.079 |
0.000 0.000 | 0.000 |
0.000 0.000 | 0.016 |
0.048 0.000 | 0.080 |
0.842 0.804 | 0.859 |
0.093 0.063 | 0.122 |
|||
| Plot | Lyso | Other | |||||||||||
| Expt C |
8 peptides |
22 spectra |
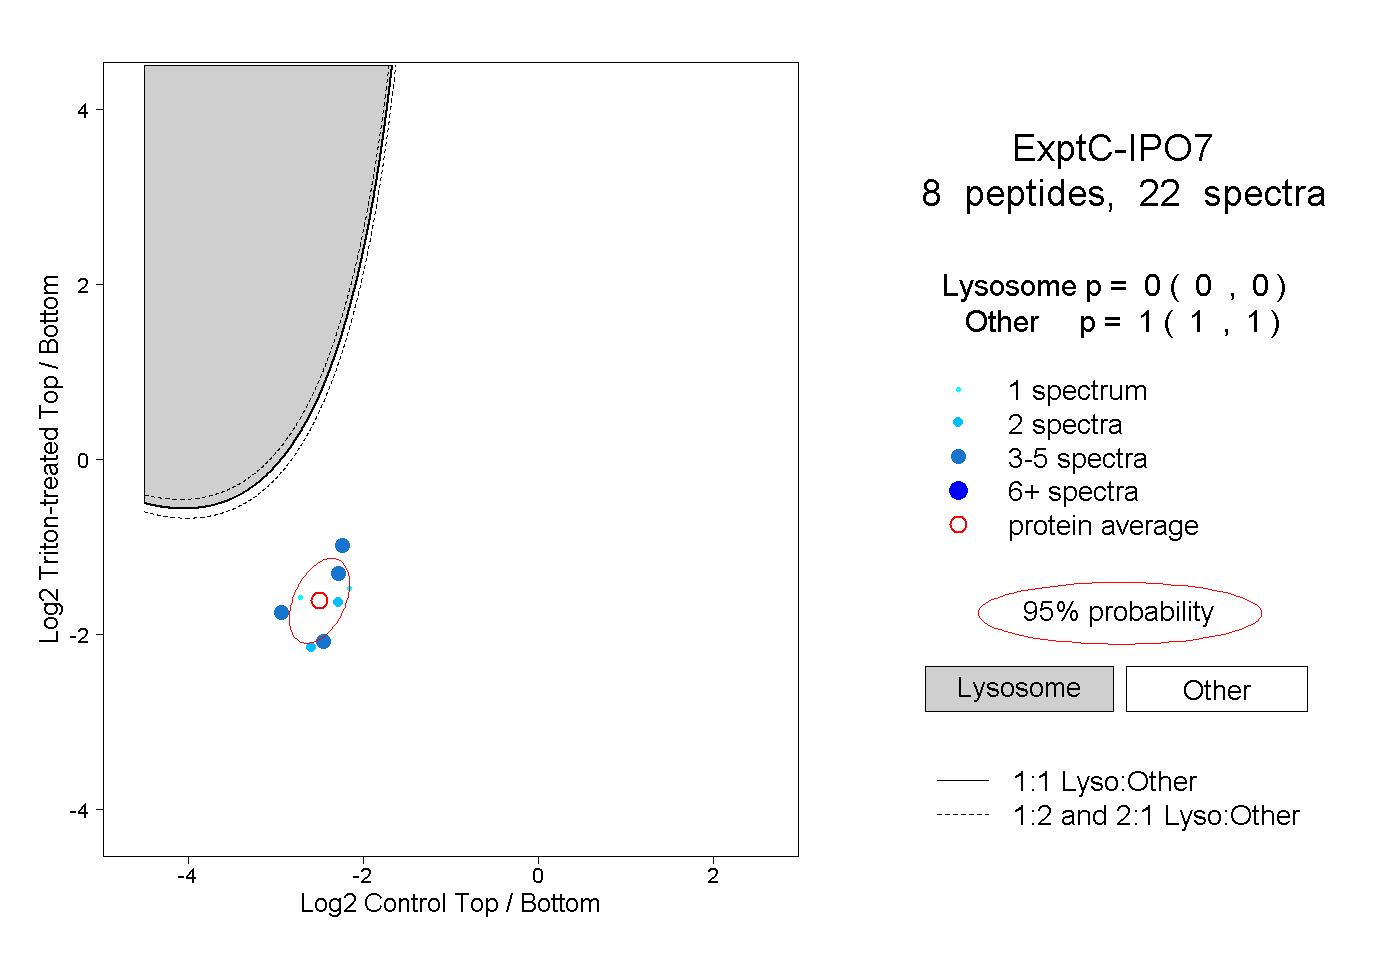 |
0.000 0.000 | 0.000 |
1.000 1.000 | 1.000 |