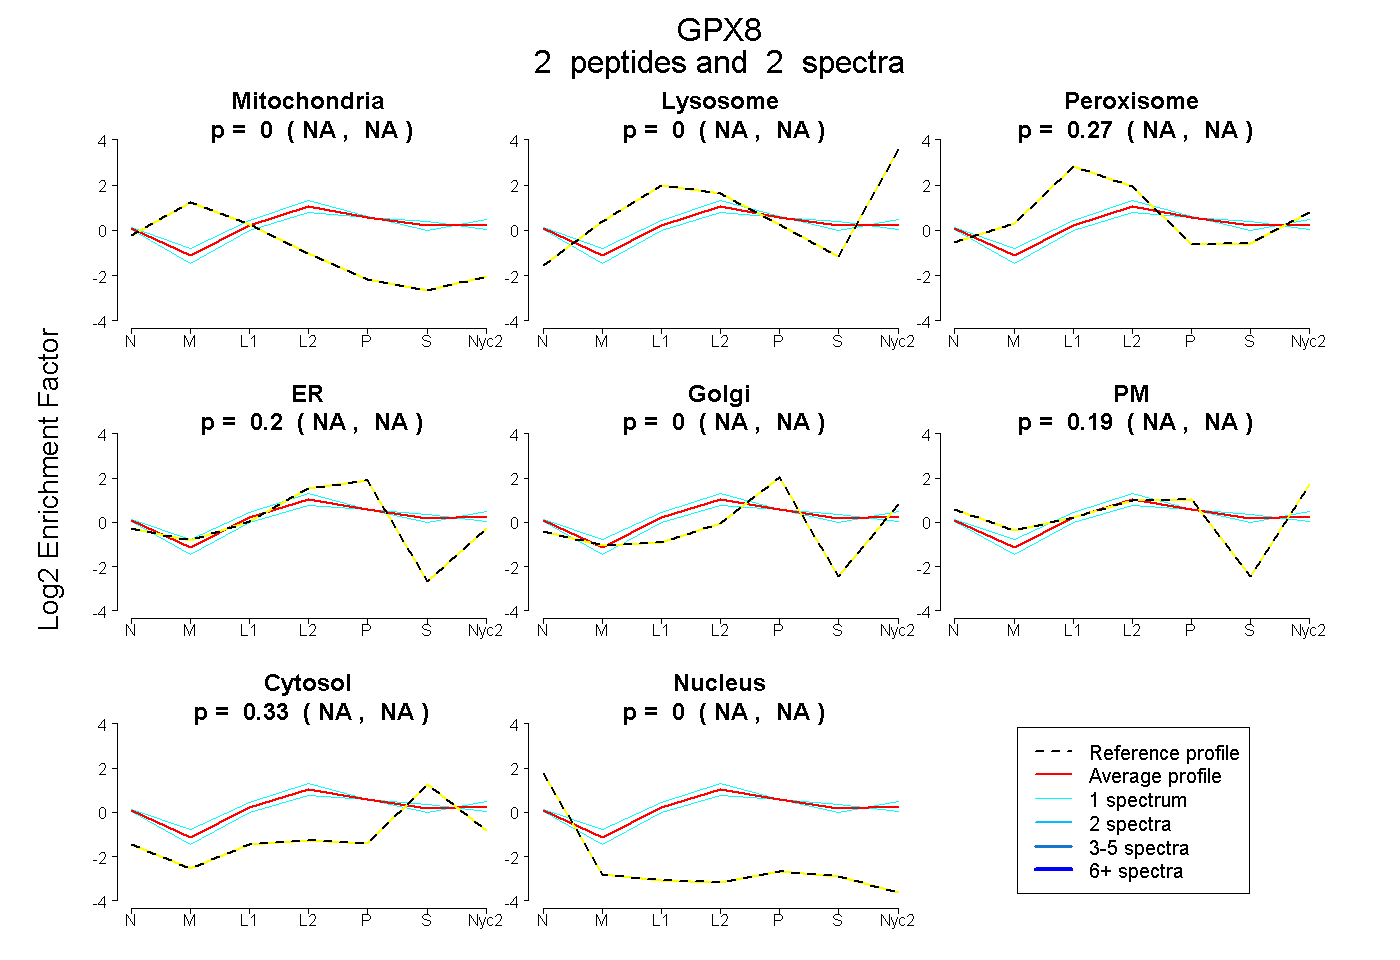
 2
2peptides
spectra
NA | NA
NA | NA
NA | NA
NA | NA
NA | NA
NA | NA
NA | NA
NA | NA
| Plot | Mito | Lyso | Perox | ER | Golgi | PM | Cytosol | Nucleus | |||||
| Expt A |
2 peptides |
2 spectra |
|
0.000 NA | NA |
0.000 NA | NA |
0.272 NA | NA |
0.202 NA | NA |
0.000 NA | NA |
0.193 NA | NA |
0.333 NA | NA |
0.000 NA | NA |
| 1 spectrum, EVESFAR | 0.000 | 0.000 | 0.338 | 0.164 | 0.000 | 0.246 | 0.252 | 0.000 | ||
| 1 spectrum, ILGPEAEPAFR | 0.000 | 0.000 | 0.206 | 0.239 | 0.000 | 0.141 | 0.414 | 0.000 |
| Plot | Lyso | Other | |||||||||||
| Expt C |
1 peptide |
1 spectrum |
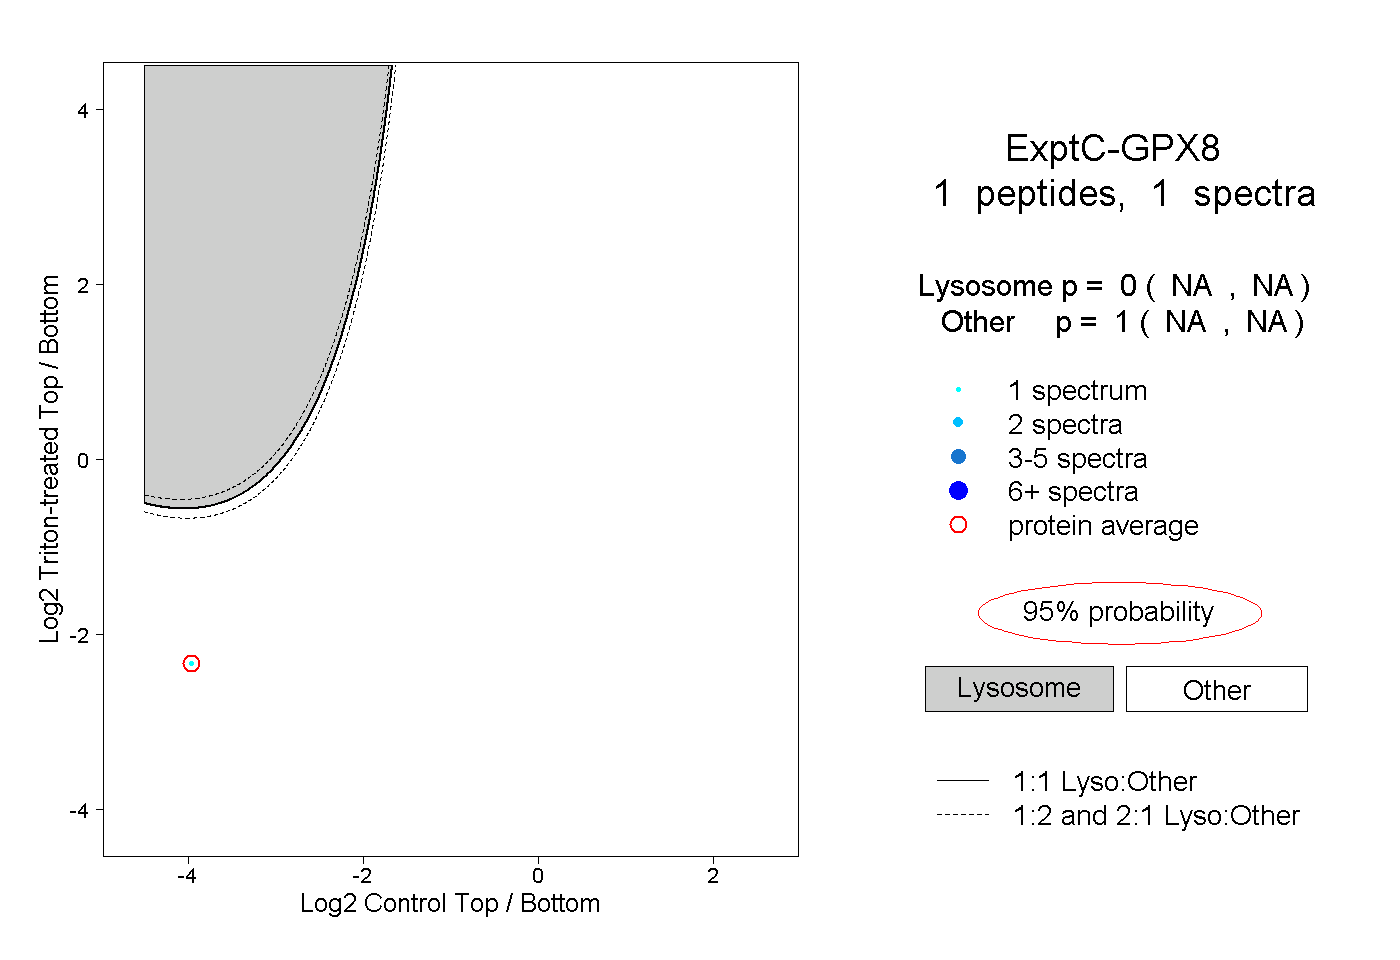 |
0.000 NA | NA |
1.000 NA | NA |