20
20peptides
spectra
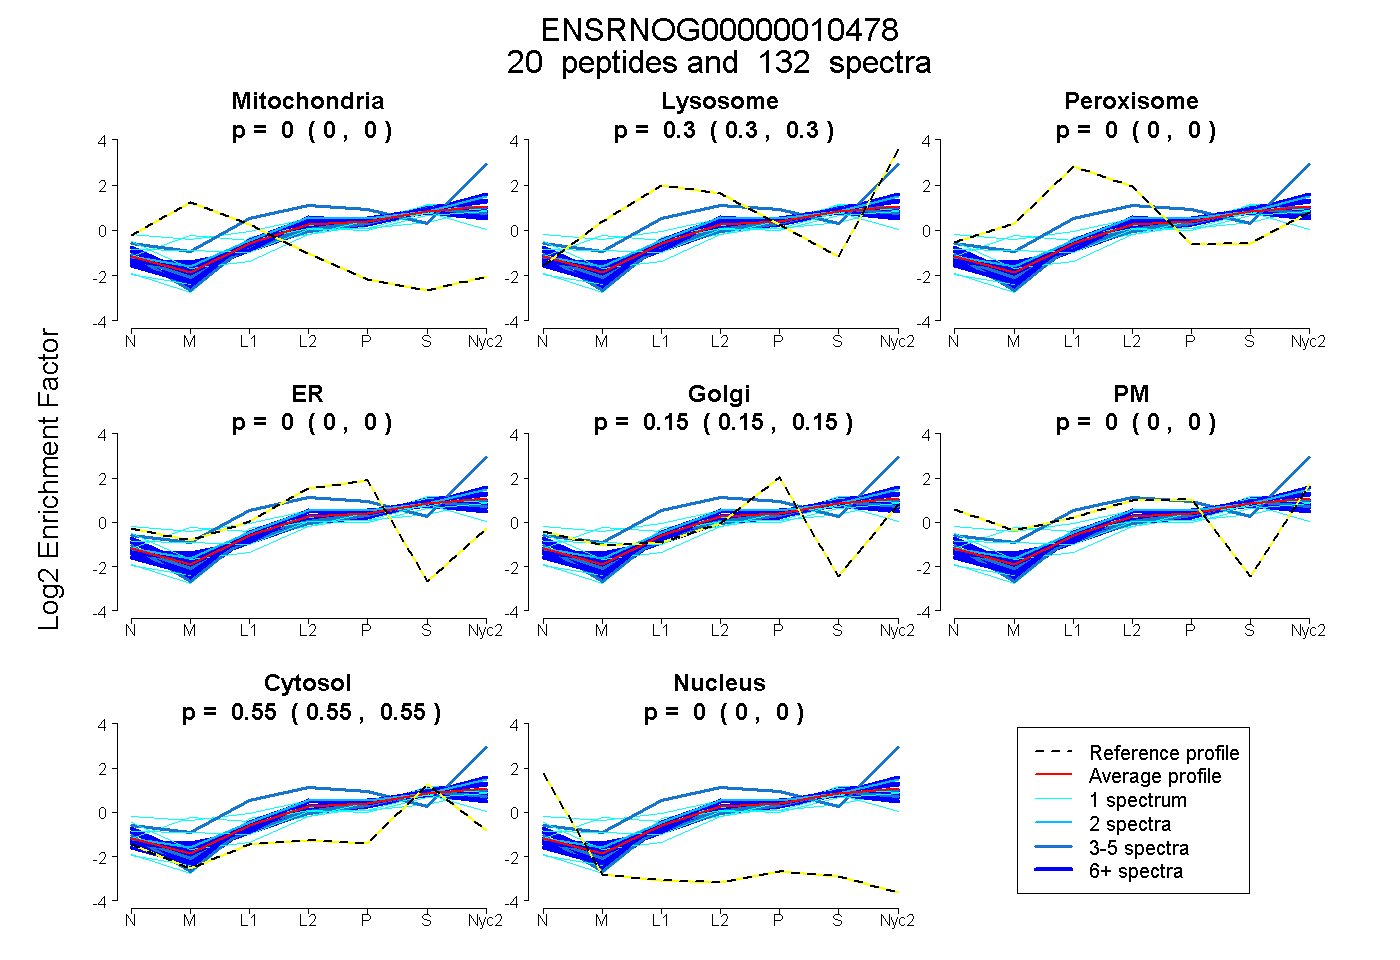
0.000 | 0.000
0.297 | 0.302
0.000 | 0.000
0.000 | 0.000
0.148 | 0.153
0.000 | 0.000
0.548 | 0.551
0.000 | 0.000
13peptides
spectra
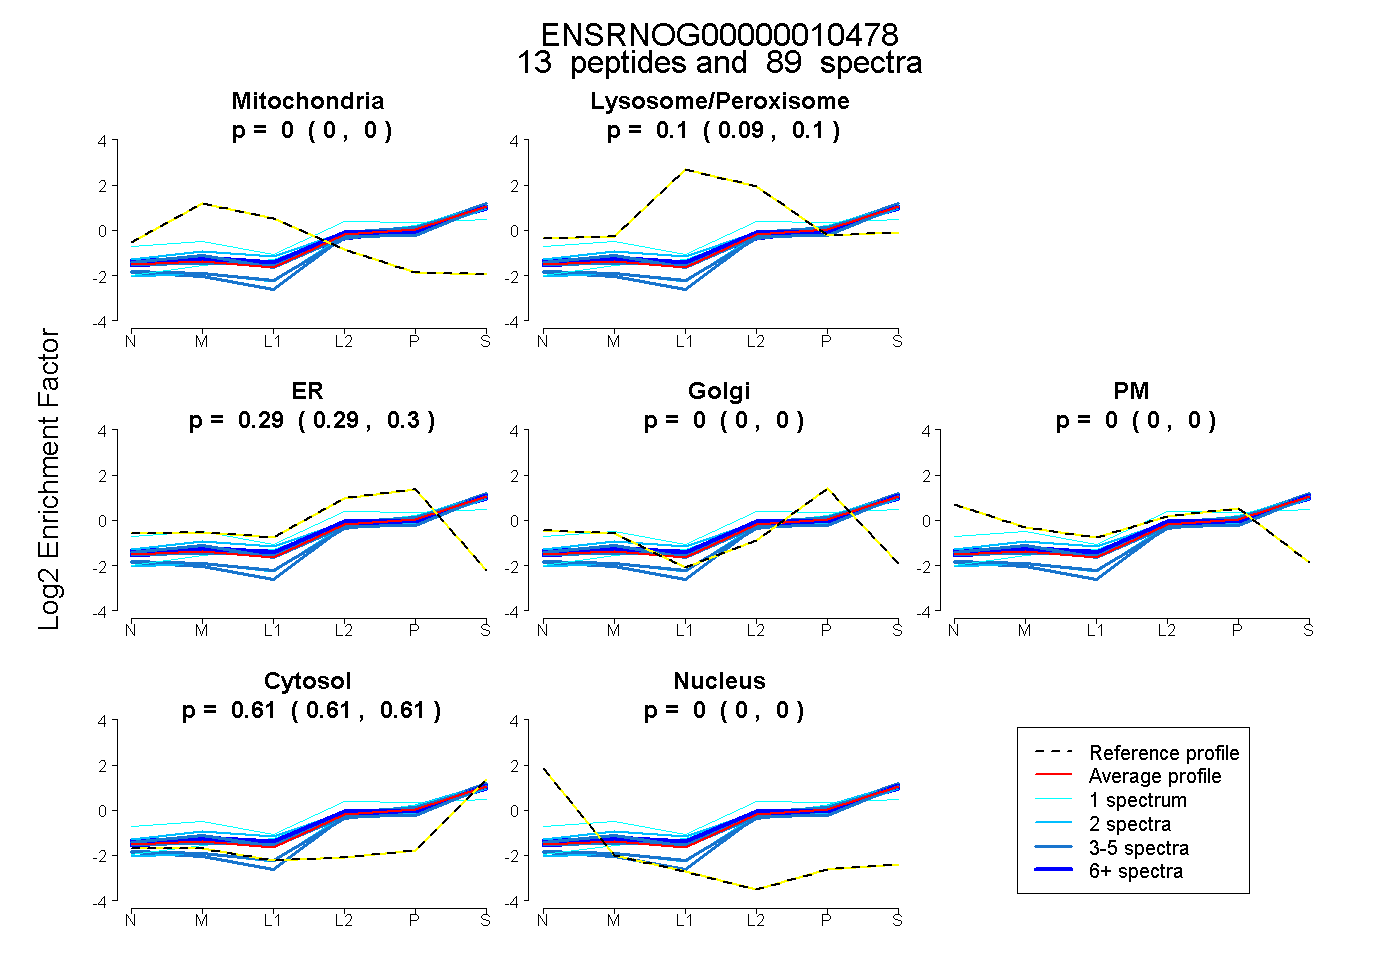
0.000 | 0.000
0.092 | 0.100
0.291 | 0.297
0.000 | 0.000
0.000 | 0.000
0.607 | 0.611
0.000 | 0.000
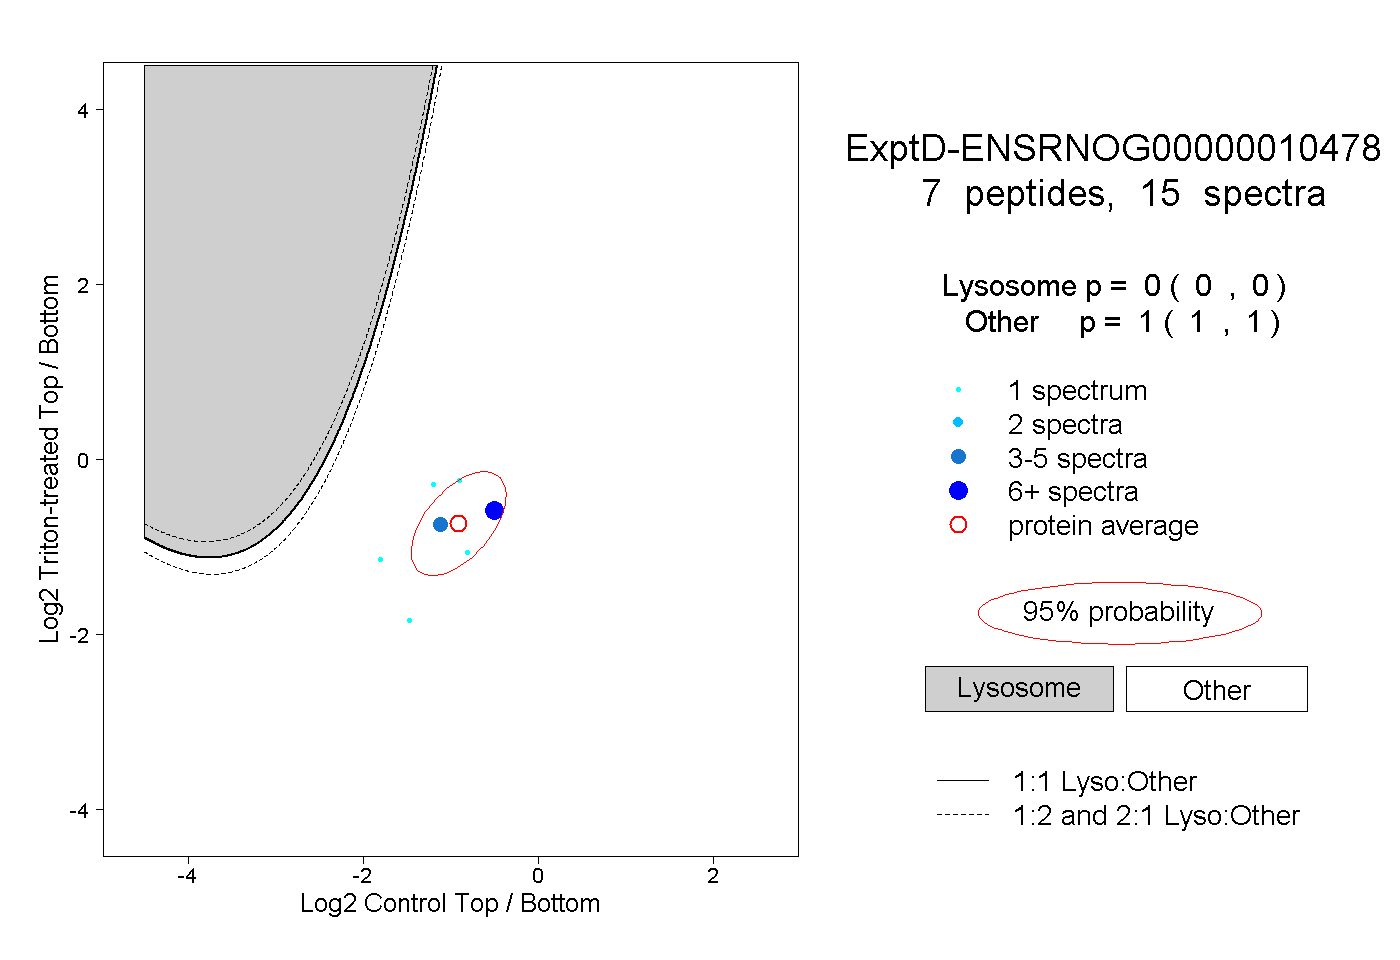
15peptides
spectra
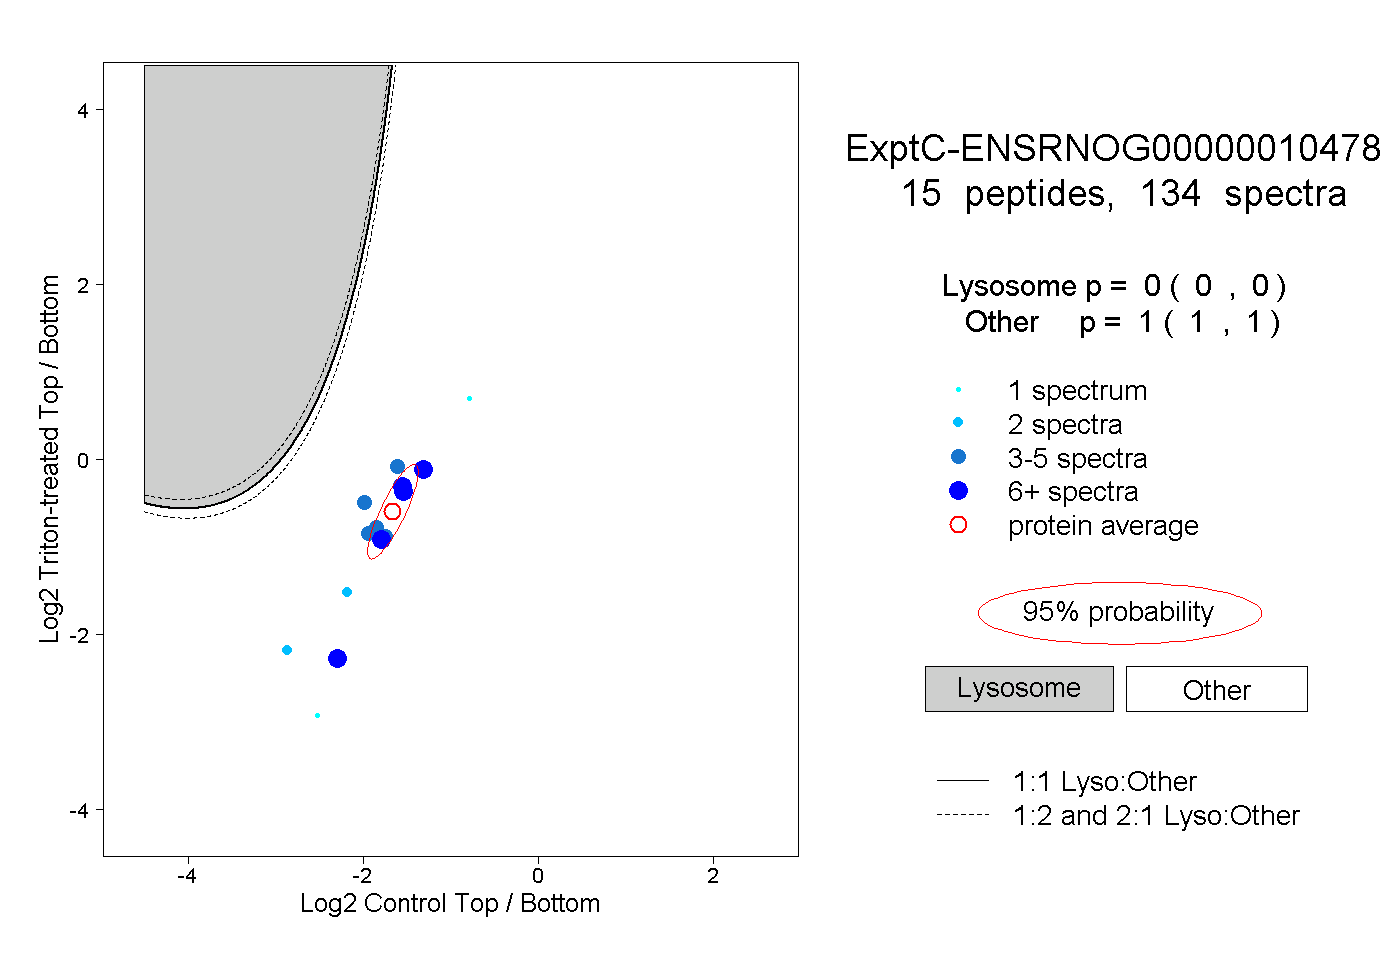
0.000 | 0.000
1.000 | 1.000