 4
4peptides
spectra
0.000 | 0.000
0.616 | 0.933
0.000 | 0.243
0.000 | 0.134
0.000 | 0.000
0.000 | 0.000
0.000 | 0.113
0.000 | 0.000
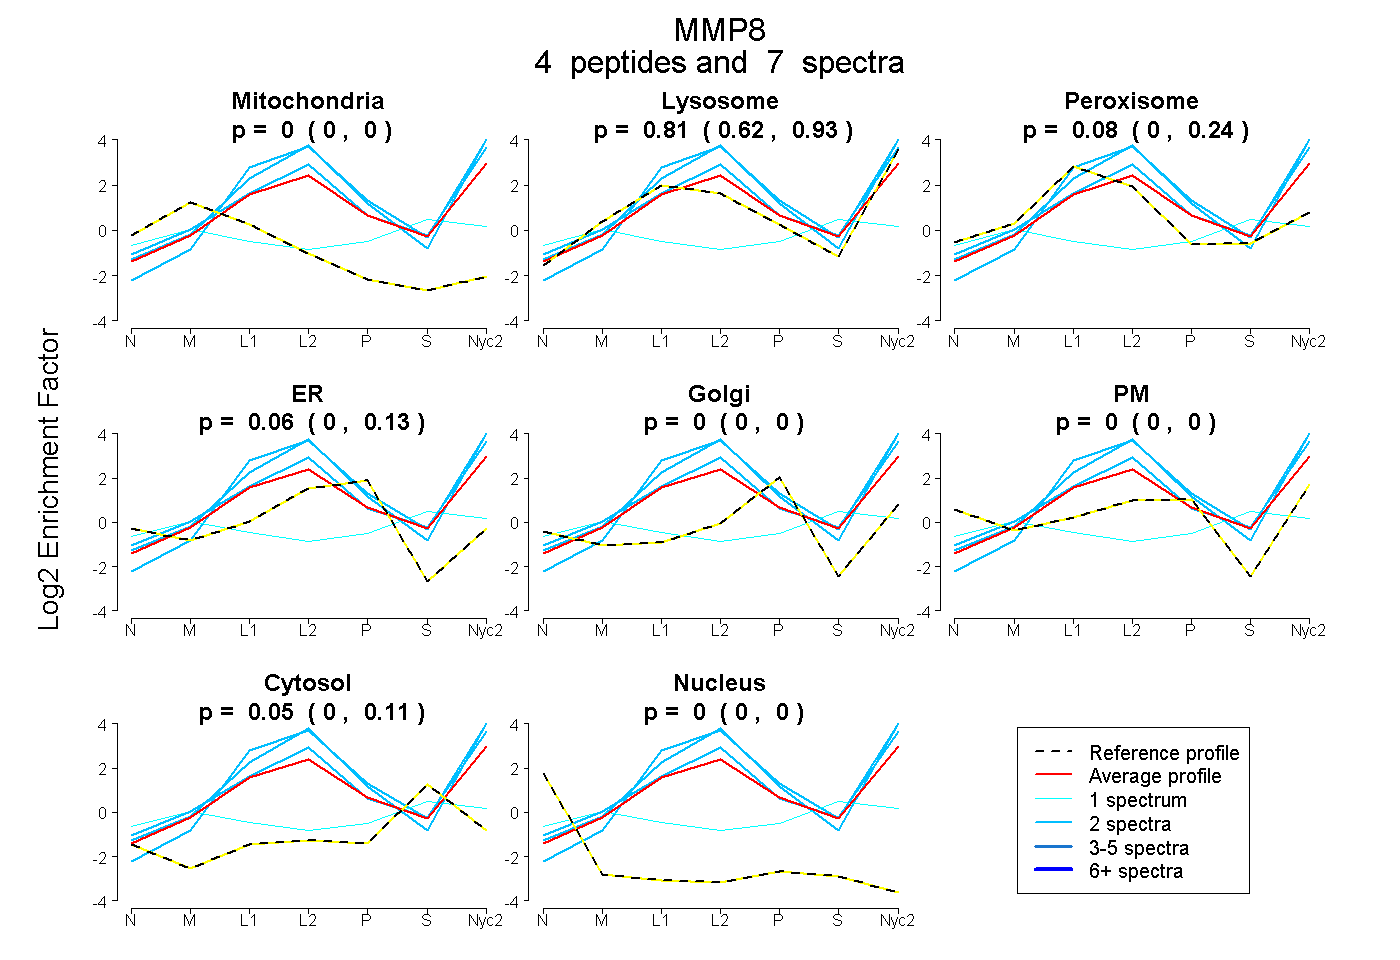
| Plot | Mito | Lyso | Perox | ER | Golgi | PM | Cytosol | Nucleus | |||||
| Expt A |
4 peptides |
7 spectra |
|
0.000 0.000 | 0.000 |
0.813 0.616 | 0.933 |
0.076 0.000 | 0.243 |
0.060 0.000 | 0.134 |
0.000 0.000 | 0.000 |
0.000 0.000 | 0.000 |
0.052 0.000 | 0.113 |
0.000 0.000 | 0.000 |
| 1 spectrum, FYHLPSNQFR | 0.207 | 0.230 | 0.000 | 0.000 | 0.031 | 0.035 | 0.496 | 0.000 | ||
| 2 spectra, GEIYFFK | 0.000 | 0.955 | 0.045 | 0.001 | 0.000 | 0.000 | 0.000 | 0.000 | ||
| 2 spectra, FDAATTLR | 0.000 | 1.000 | 0.000 | 0.000 | 0.000 | 0.000 | 0.000 | 0.000 | ||
| 2 spectra, DISNYGFPR | 0.000 | 1.000 | 0.000 | 0.000 | 0.000 | 0.000 | 0.000 | 0.000 |
| Plot | Lyso | Other | |||||||||||
| Expt C |
6 peptides |
22 spectra |
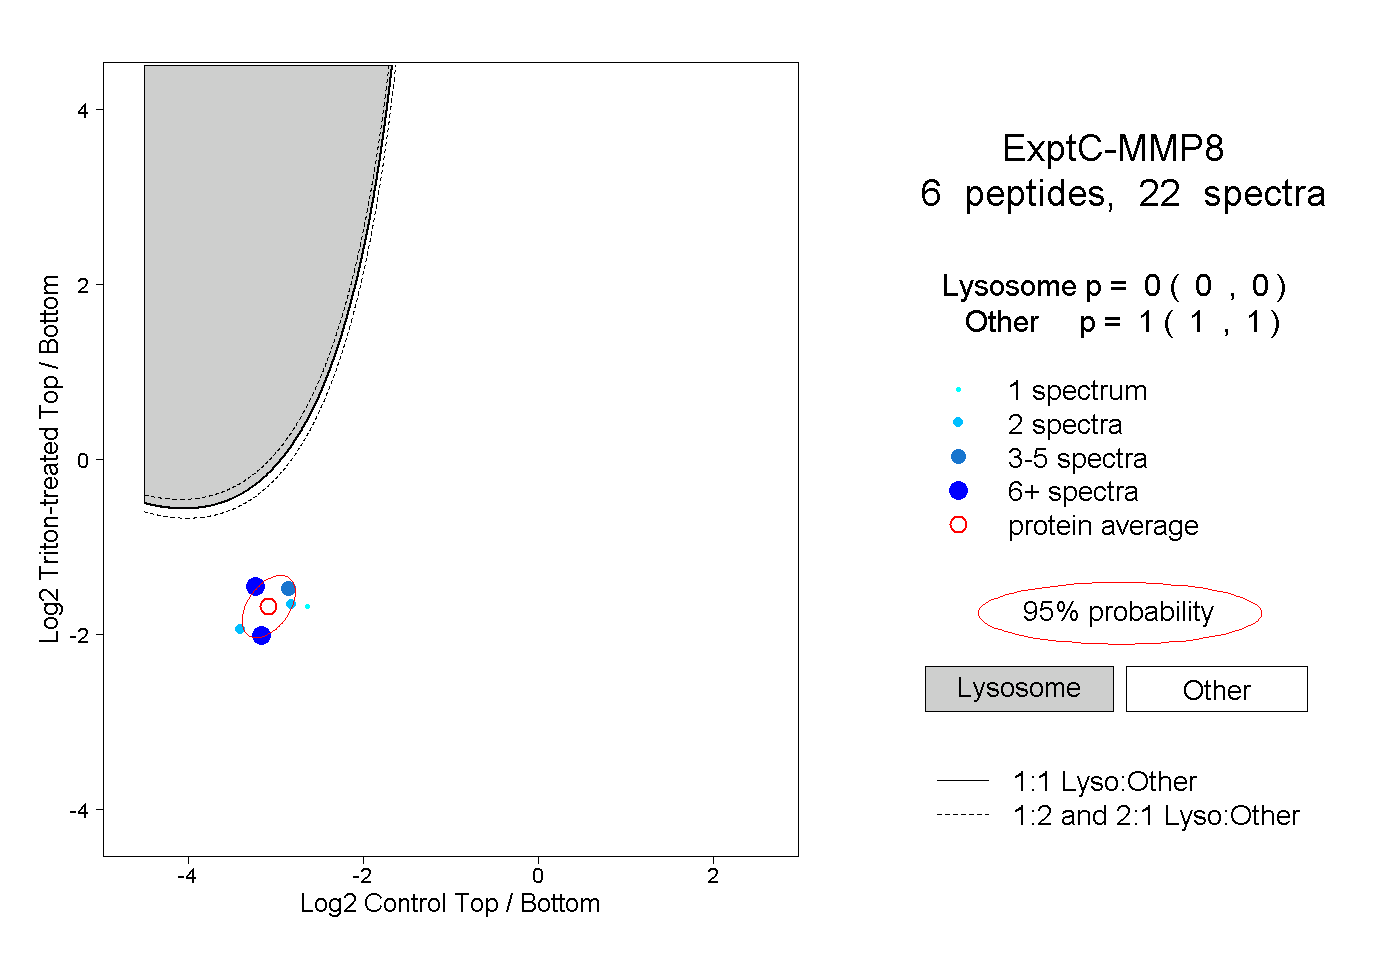 |
0.000 0.000 | 0.000 |
1.000 1.000 | 1.000 |
||||||||
| Plot | Lyso | Other | |||||||||||
| Expt D |
3 peptides |
3 spectra |
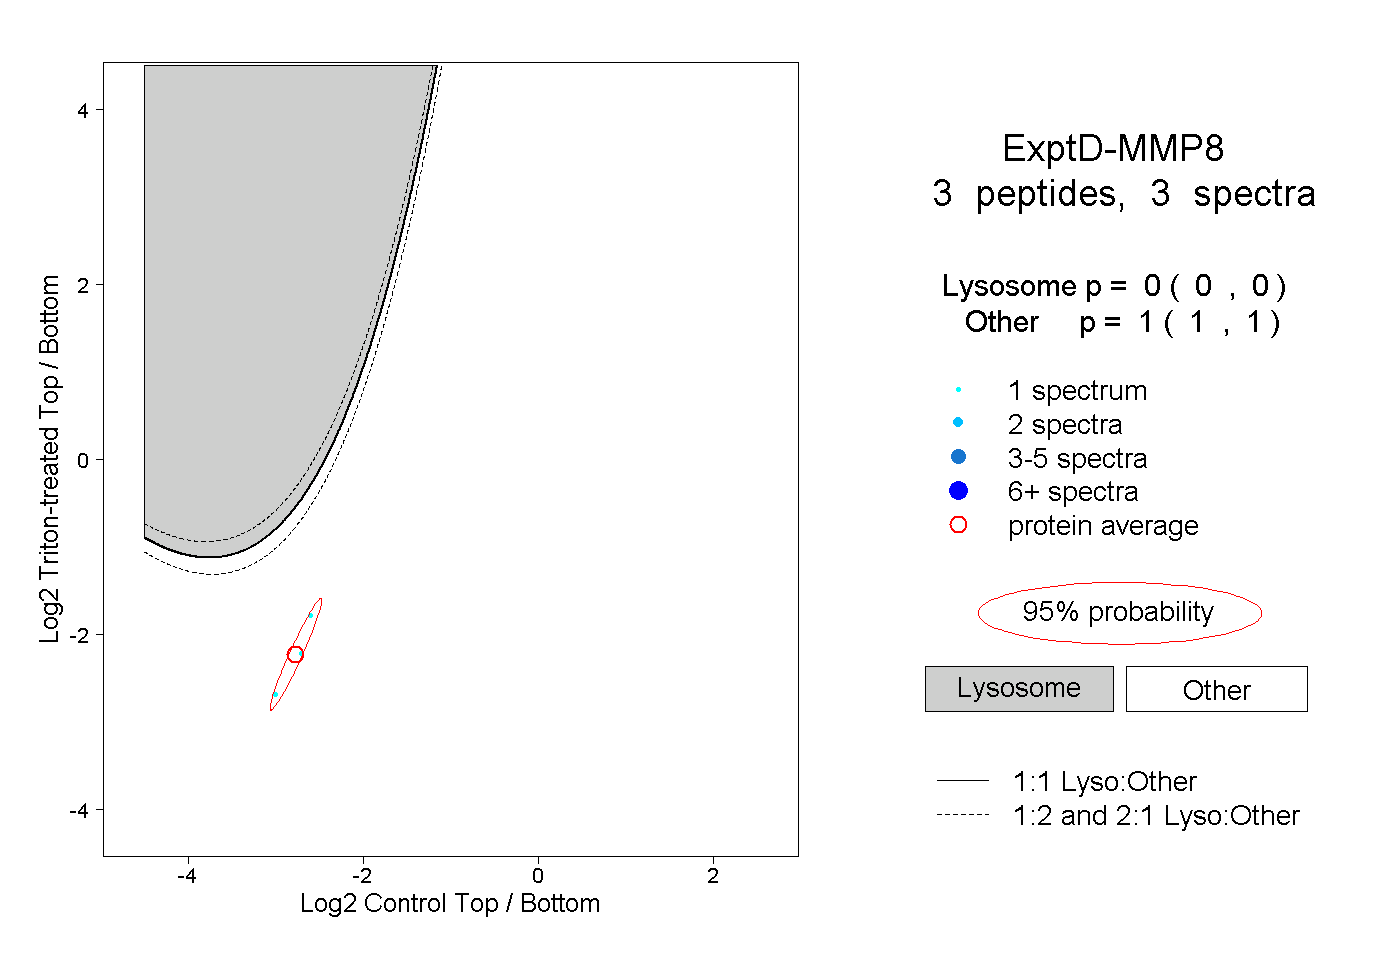 |
0.000 0.000 | 0.000 |
1.000 1.000 | 1.000 |