 5
5peptides
spectra
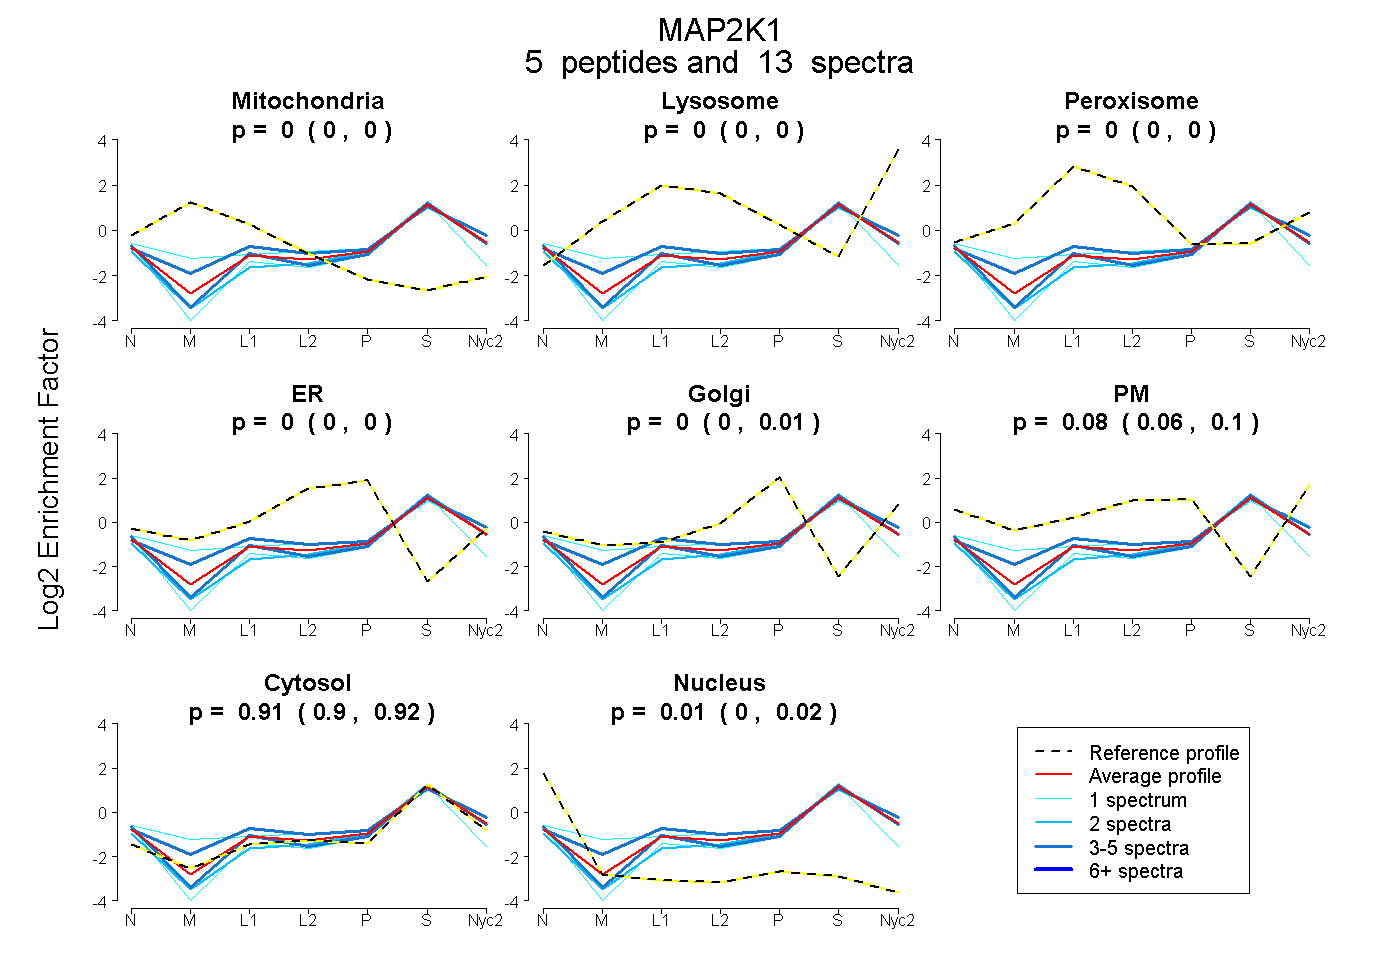
0.000 | 0.000
0.000 | 0.000
0.000 | 0.000
0.000 | 0.000
0.000 | 0.006
0.060 | 0.096
0.897 | 0.918
0.000 | 0.017
1peptide
spectra
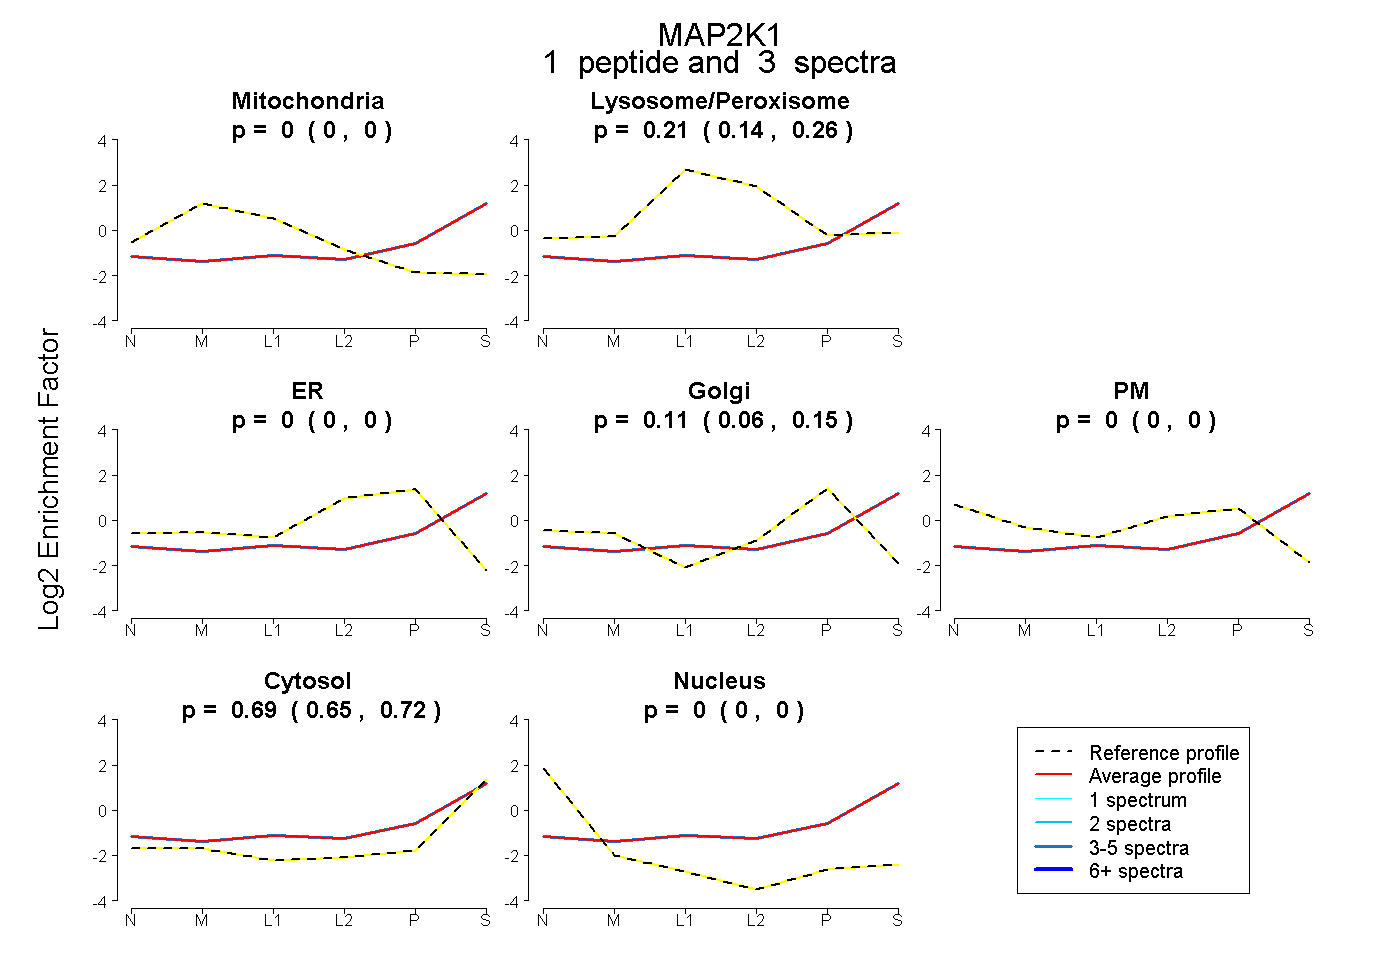
0.000 | 0.000
0.138 | 0.257
0.000 | 0.000
0.060 | 0.148
0.000 | 0.000
0.651 | 0.719
0.000 | 0.000
5peptides
spectra
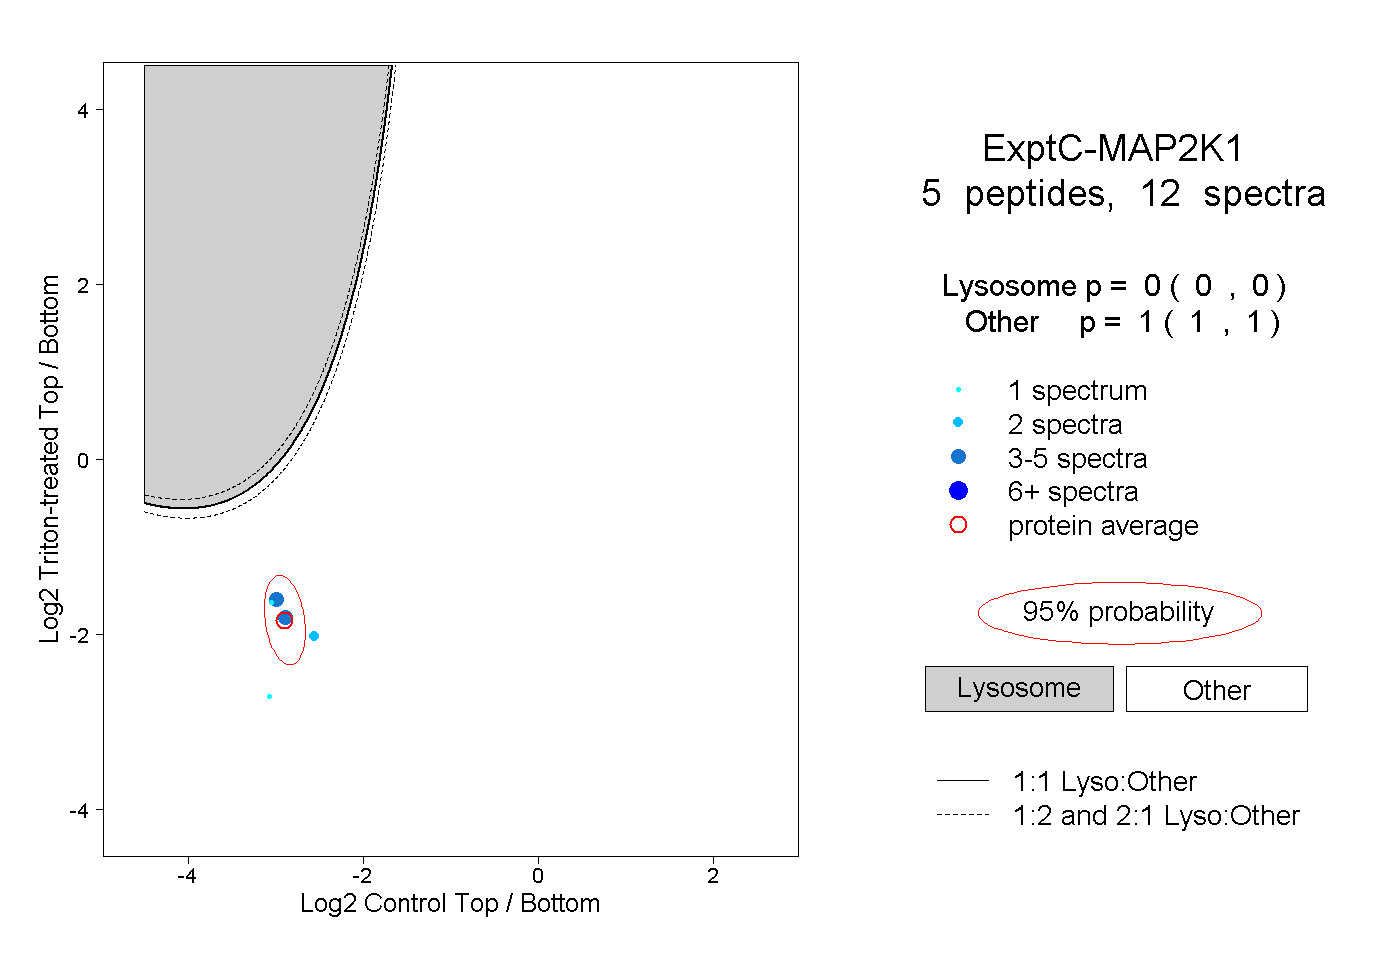
0.000 | 0.000
1.000 | 1.000