 2
2peptides
spectra
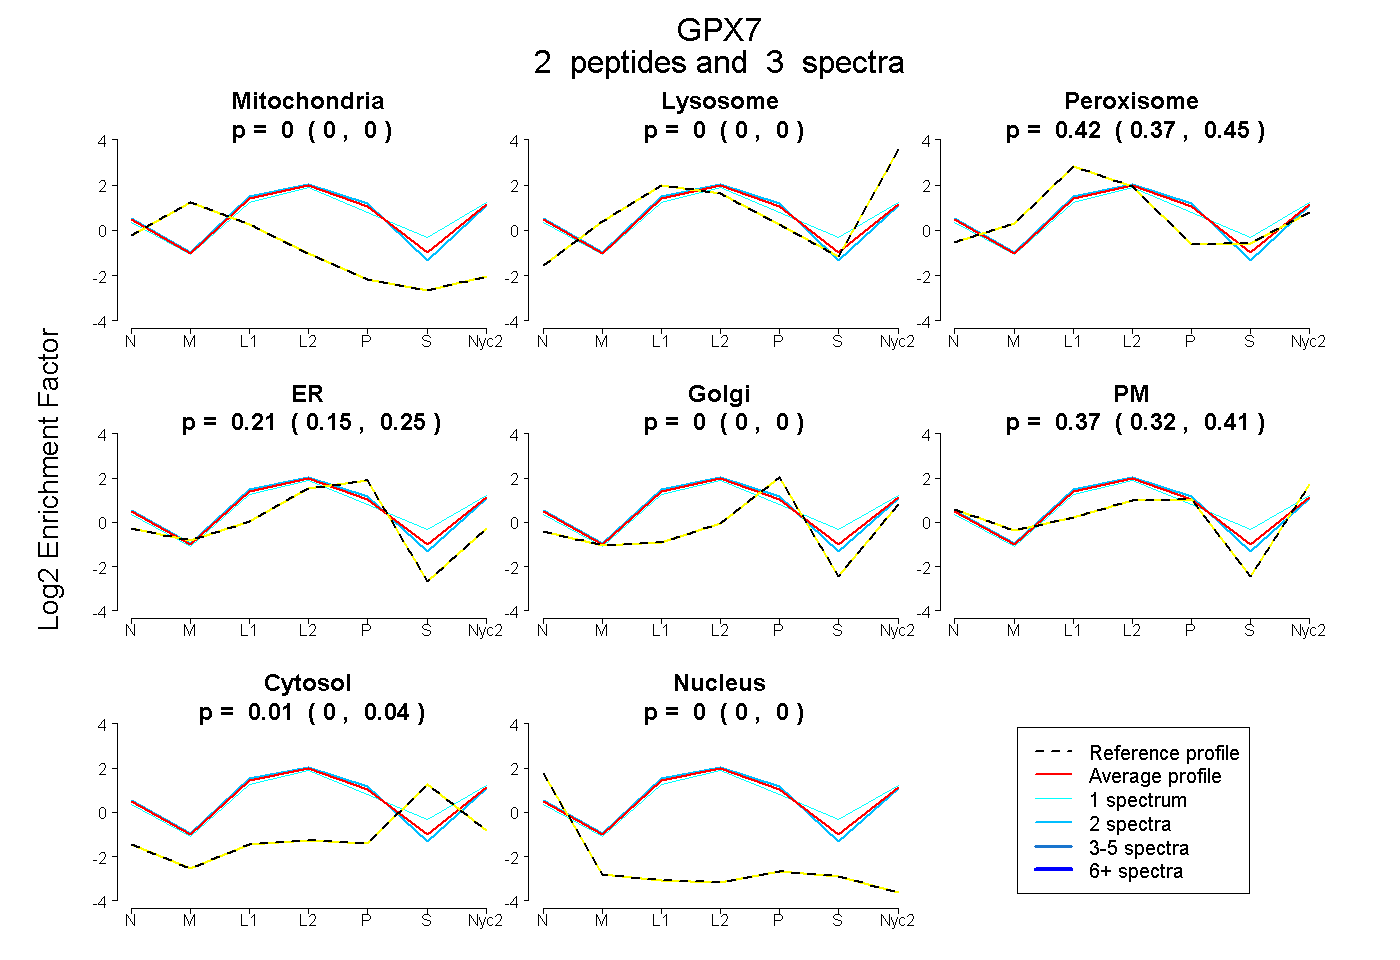
0.000 | 0.000
0.000 | 0.000
0.368 | 0.453
0.152 | 0.246
0.000 | 0.000
0.323 | 0.406
0.000 | 0.036
0.000 | 0.000
| Plot | Mito | Lyso | Perox | ER | Golgi | PM | Cytosol | Nucleus | |||||
| Expt A |
2 peptides |
3 spectra |
|
0.000 0.000 | 0.000 |
0.000 0.000 | 0.000 |
0.417 0.368 | 0.453 |
0.208 0.152 | 0.246 |
0.000 0.000 | 0.000 |
0.370 0.323 | 0.406 |
0.005 0.000 | 0.036 |
0.000 0.000 | 0.000 |
| 1 spectrum, IAVTGTGAHPAFK | 0.000 | 0.012 | 0.441 | 0.080 | 0.000 | 0.367 | 0.100 | 0.000 | ||
| 2 spectra, EPTWNFWK | 0.000 | 0.000 | 0.383 | 0.251 | 0.000 | 0.366 | 0.000 | 0.000 |
| Plot | Lyso | Other | |||||||||||
| Expt C |
4 peptides |
17 spectra |
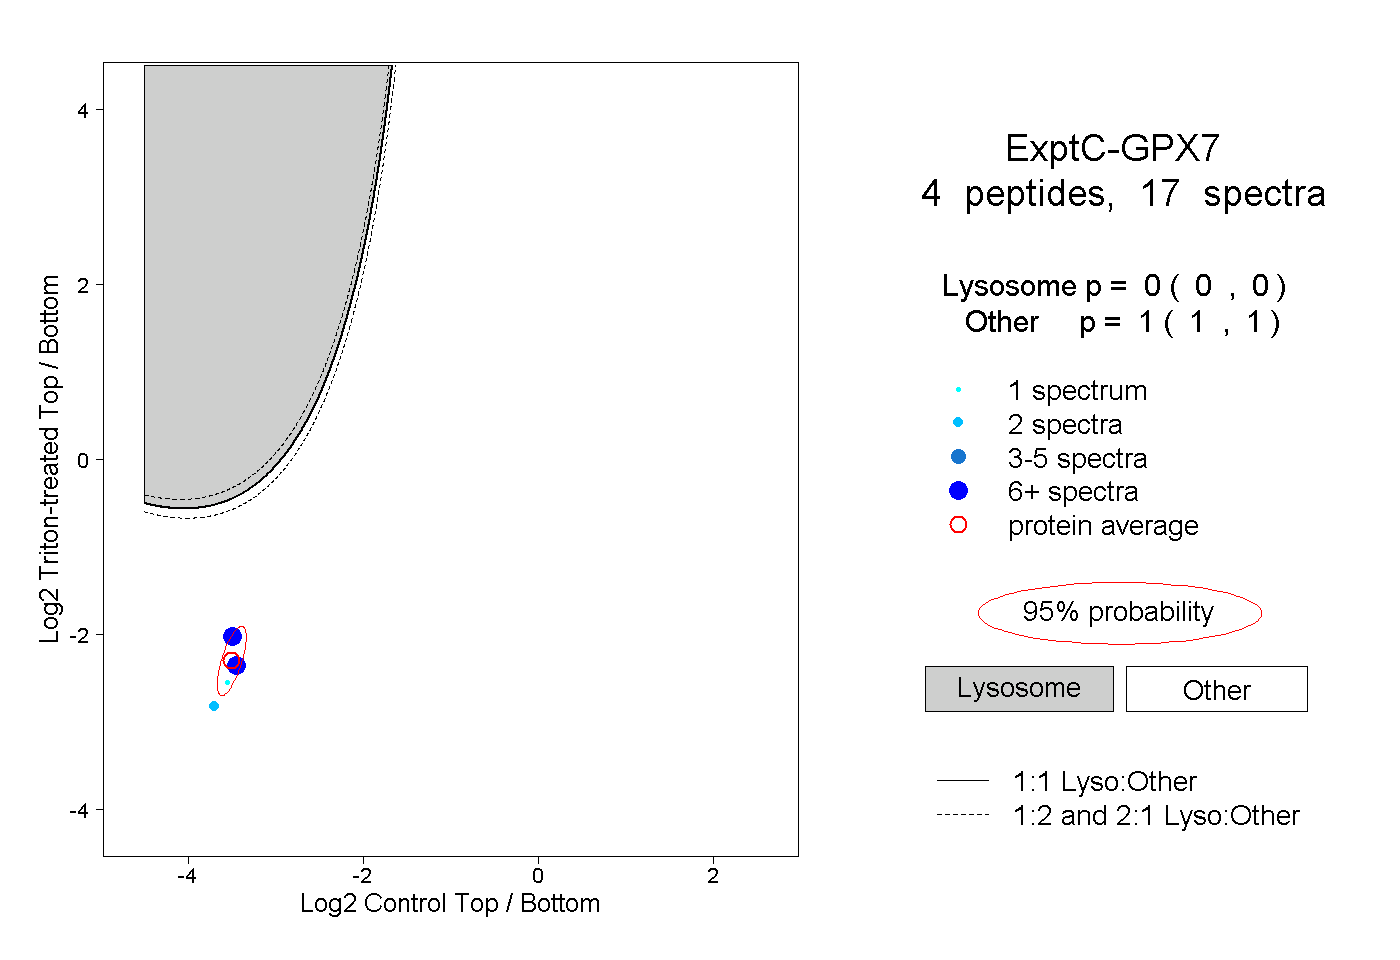 |
0.000 0.000 | 0.000 |
1.000 1.000 | 1.000 |