 3
3peptides
spectra
0.000 | 0.000
0.014 | 0.130
0.000 | 0.054
0.000 | 0.048
0.000 | 0.072
0.000 | 0.025
0.834 | 0.899
0.000 | 0.000
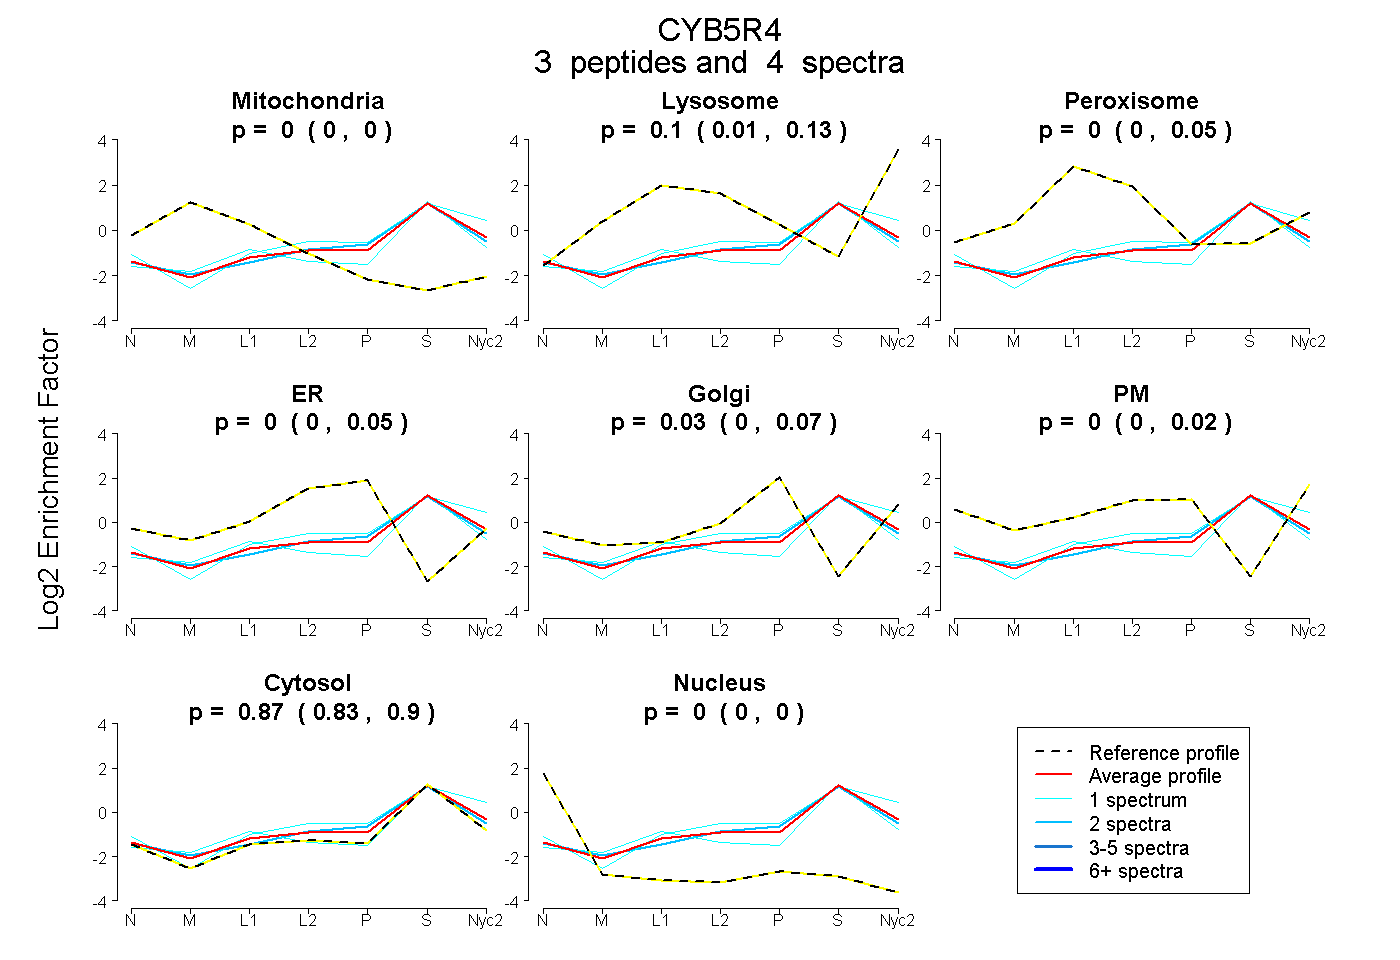
| Plot | Mito | Lyso | Perox | ER | Golgi | PM | Cytosol | Nucleus | |||||
| Expt A |
3 peptides |
4 spectra |
|
0.000 0.000 | 0.000 |
0.097 0.014 | 0.130 |
0.000 0.000 | 0.054 |
0.000 0.000 | 0.048 |
0.030 0.000 | 0.072 |
0.000 0.000 | 0.025 |
0.873 0.834 | 0.899 |
0.000 0.000 | 0.000 |
| 2 spectra, AAGADGTDLFNEVHR | 0.000 | 0.050 | 0.000 | 0.000 | 0.098 | 0.000 | 0.852 | 0.000 | ||
| 1 spectrum, TEDDIIWR | 0.053 | 0.000 | 0.064 | 0.000 | 0.000 | 0.000 | 0.883 | 0.000 | ||
| 1 spectrum, ALLSEFLQR | 0.000 | 0.161 | 0.000 | 0.000 | 0.051 | 0.003 | 0.785 | 0.000 |