 4
4peptides
spectra
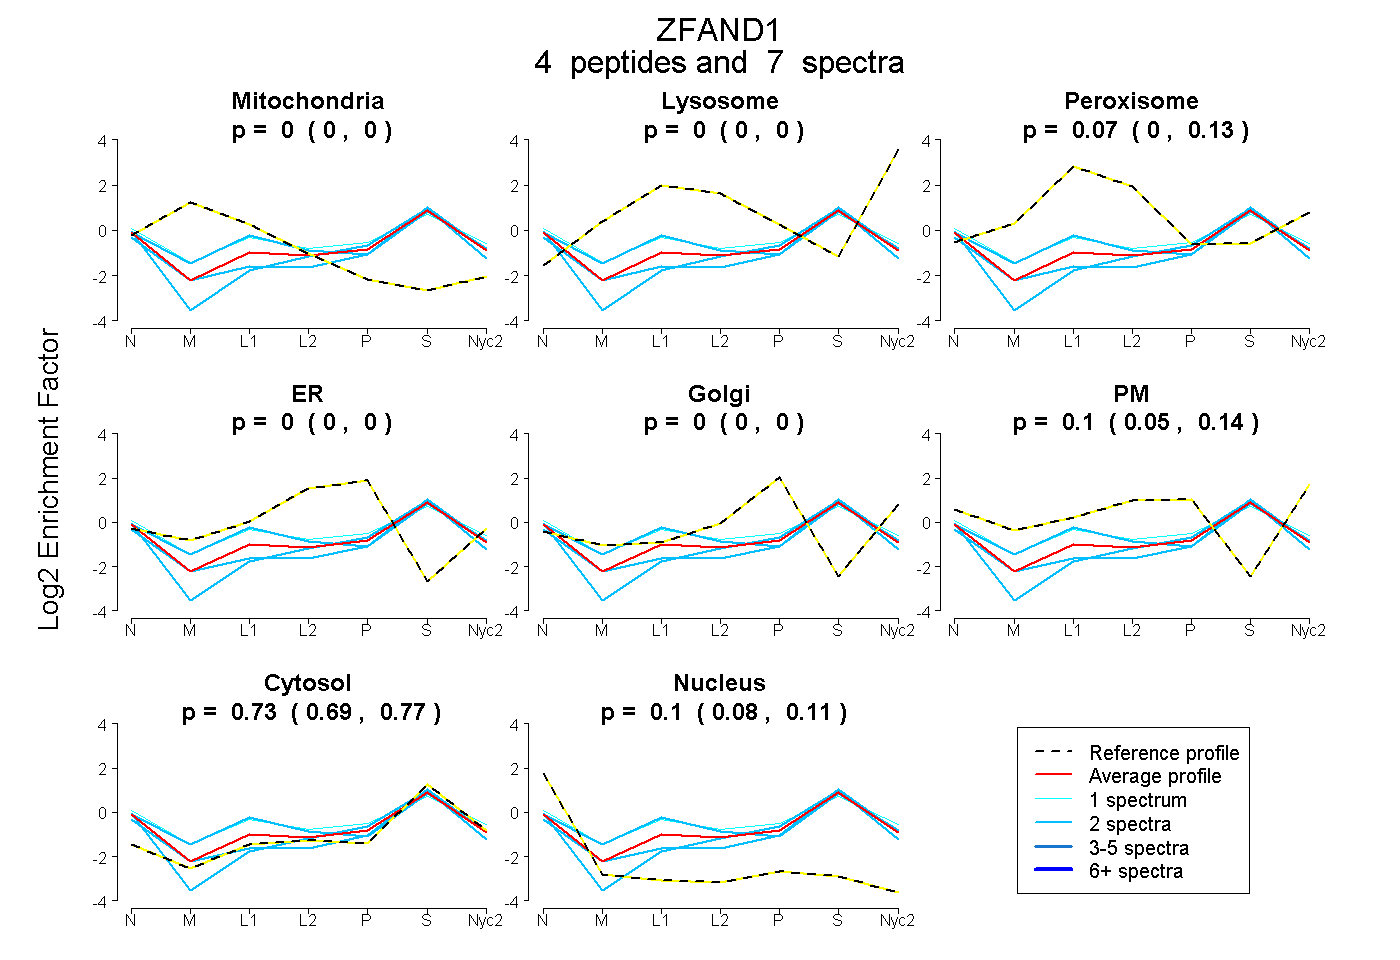
0.000 | 0.000
0.000 | 0.000
0.000 | 0.128
0.000 | 0.001
0.000 | 0.000
0.052 | 0.137
0.694 | 0.768
0.084 | 0.114
1peptide
spectrum
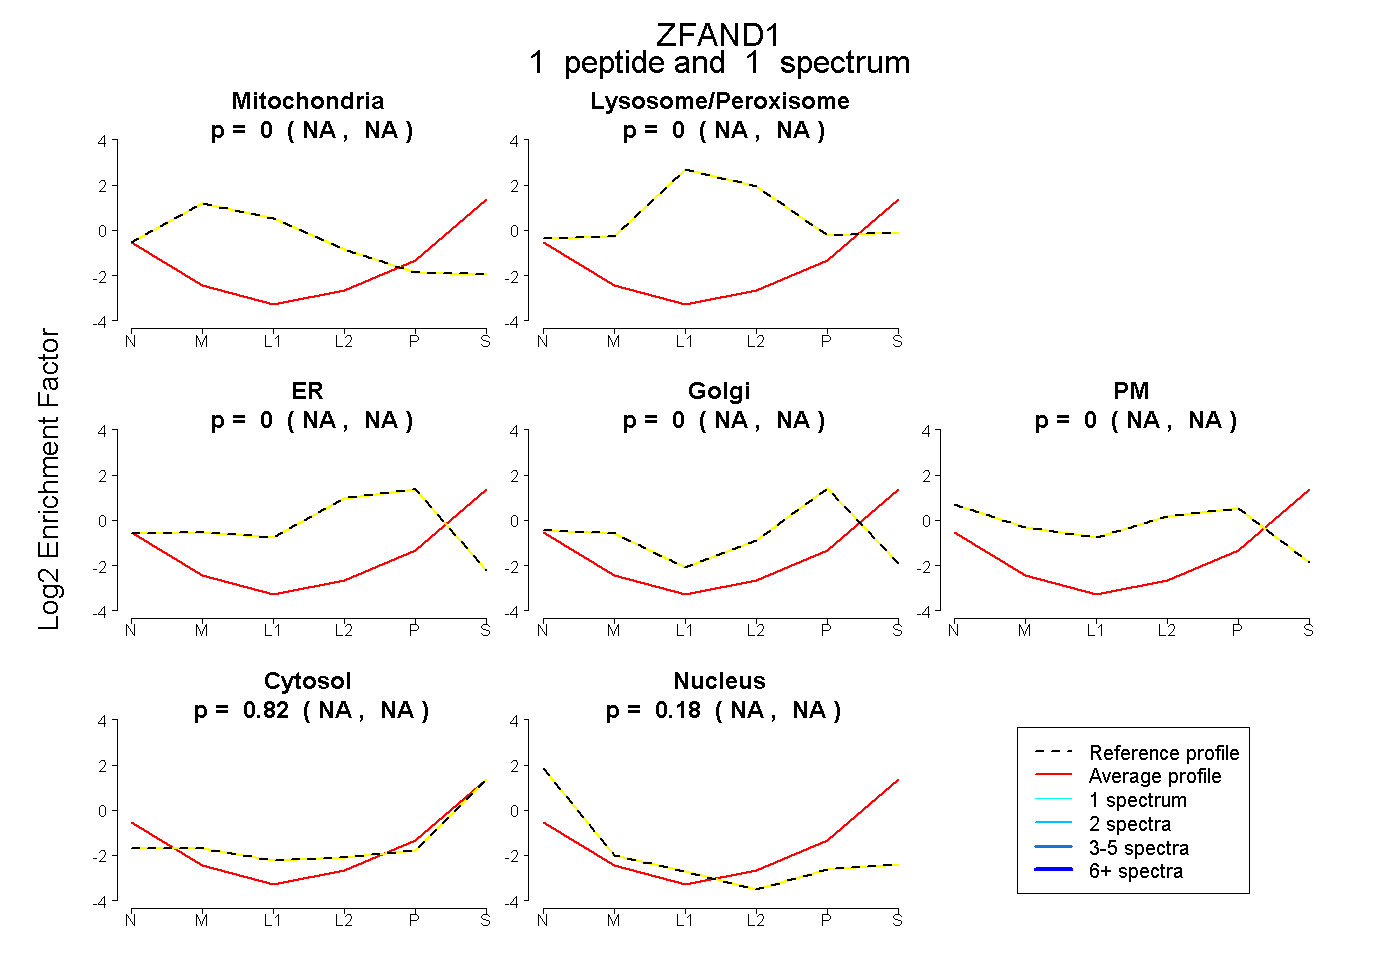
NA | NA
NA | NA
NA | NA
NA | NA
NA | NA
NA | NA
NA | NA
1peptide
spectra
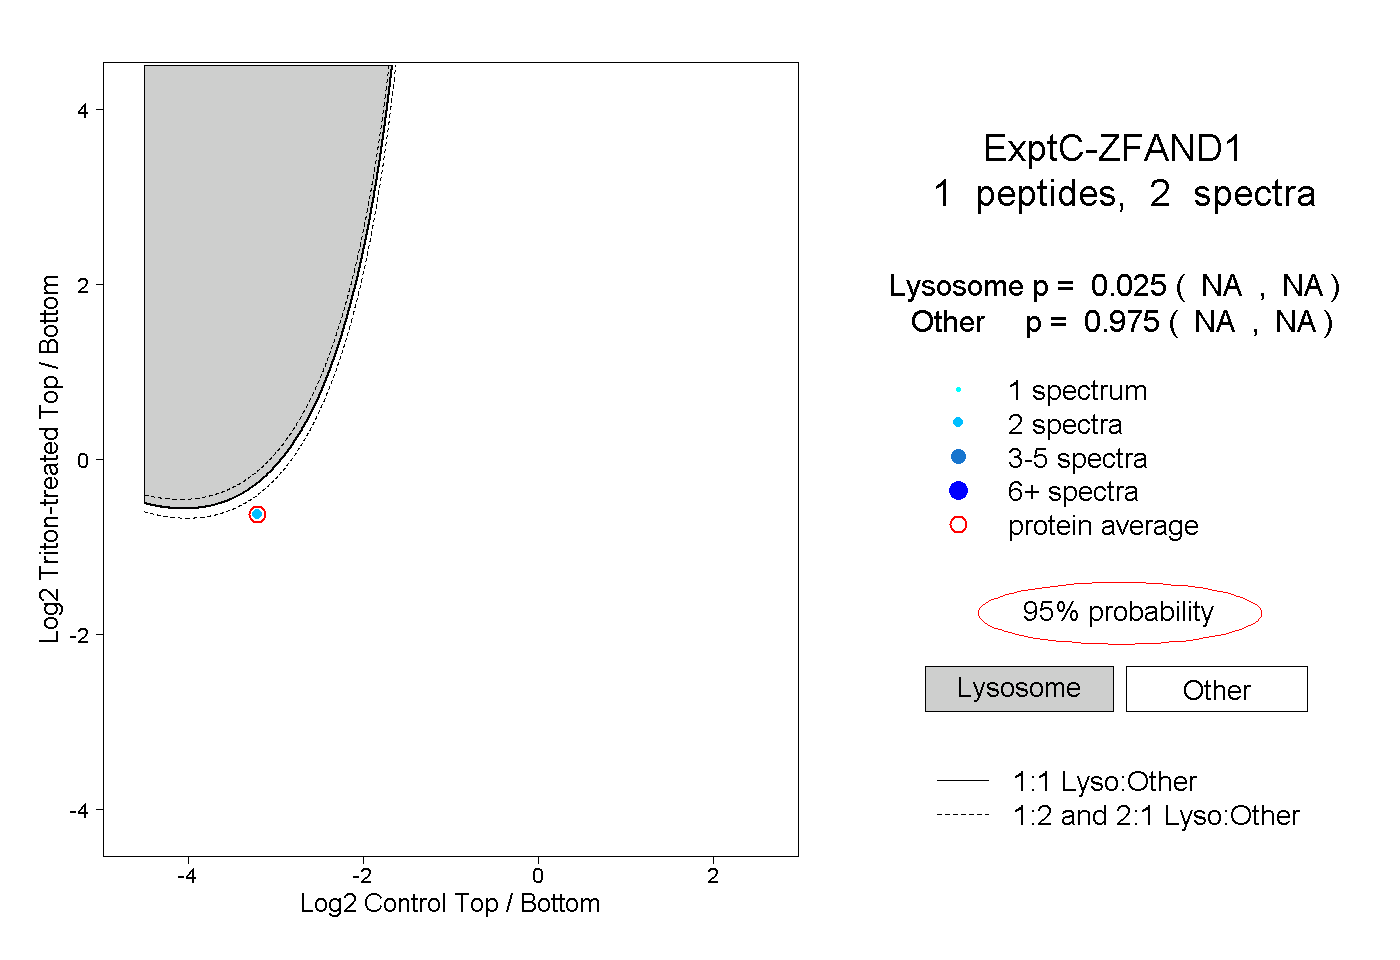
NA | NA
NA | NA