 4
4peptides
spectra
0.000 | 0.000
0.000 | 0.000
0.000 | 0.000
0.150 | 0.490
0.000 | 0.269
0.000 | 0.000
0.421 | 0.591
0.000 | 0.064
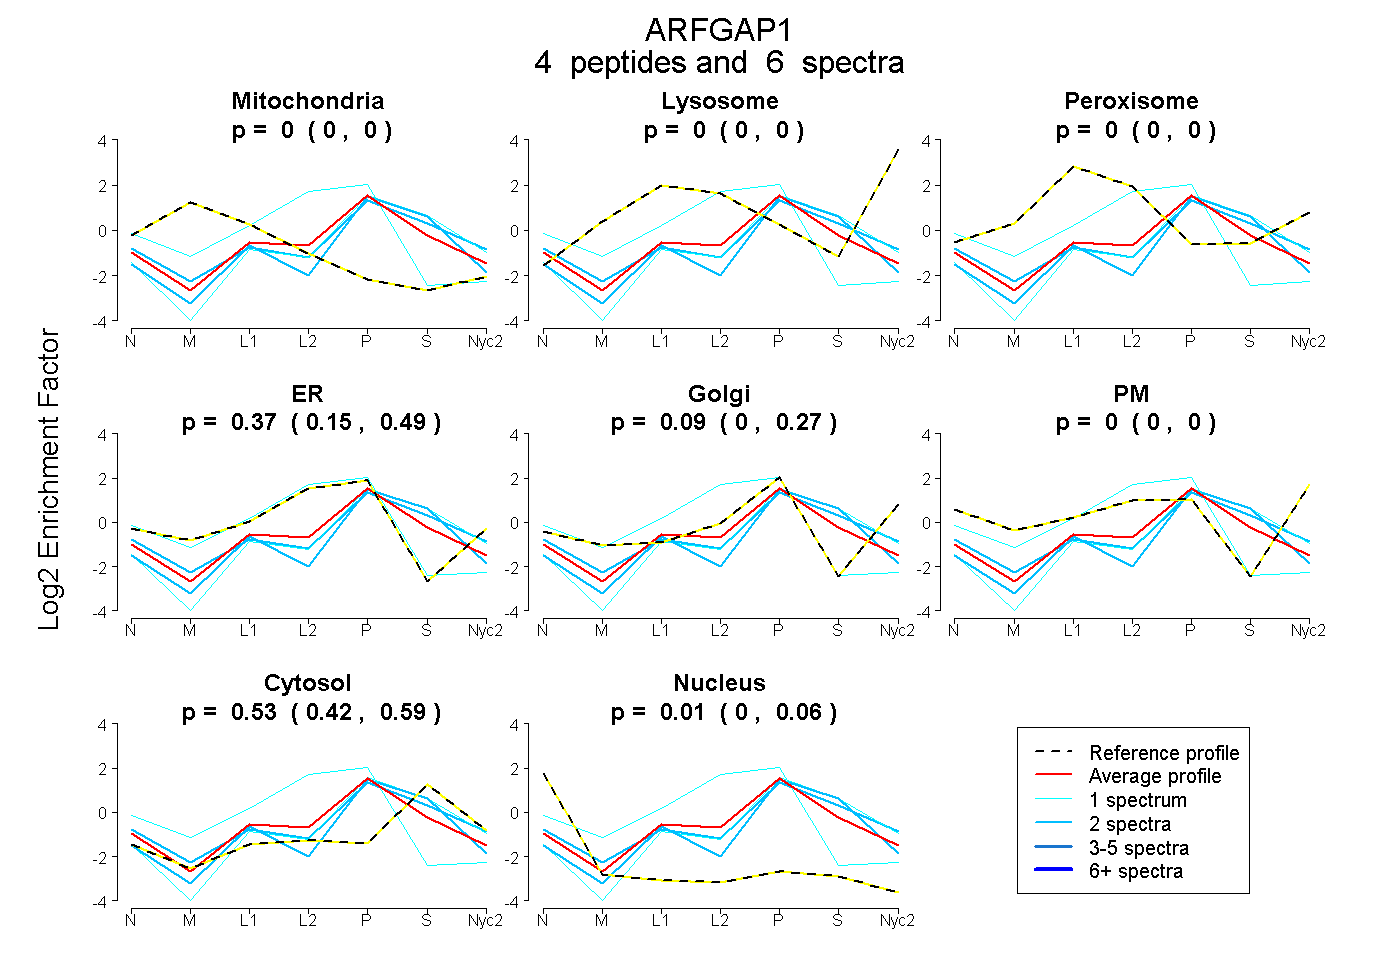
| Plot | Mito | Lyso | Perox | ER | Golgi | PM | Cytosol | Nucleus | |||||
| Expt A |
4 peptides |
6 spectra |
|
0.000 0.000 | 0.000 |
0.000 0.000 | 0.000 |
0.000 0.000 | 0.000 |
0.373 0.150 | 0.490 |
0.088 0.000 | 0.269 |
0.000 0.000 | 0.000 |
0.532 0.421 | 0.591 |
0.007 0.000 | 0.064 |
| 2 spectra, DVTTFFSGK | 0.000 | 0.000 | 0.000 | 0.024 | 0.409 | 0.000 | 0.567 | 0.000 | ||
| 1 spectrum, NSNSDGWESWEGASGEGR | 0.000 | 0.000 | 0.000 | 0.000 | 0.312 | 0.000 | 0.688 | 0.000 | ||
| 2 spectra, SPSSDSWTCADASTGR | 0.000 | 0.000 | 0.000 | 0.000 | 0.273 | 0.000 | 0.722 | 0.004 | ||
| 1 spectrum, VATLAEGK | 0.000 | 0.000 | 0.000 | 0.920 | 0.000 | 0.000 | 0.000 | 0.080 |
| Plot | Mito | Lyso or Perox | ER | Golgi | PM | Cytosol | Nucleus | ||||||
| Expt B |
1 peptide |
5 spectra |
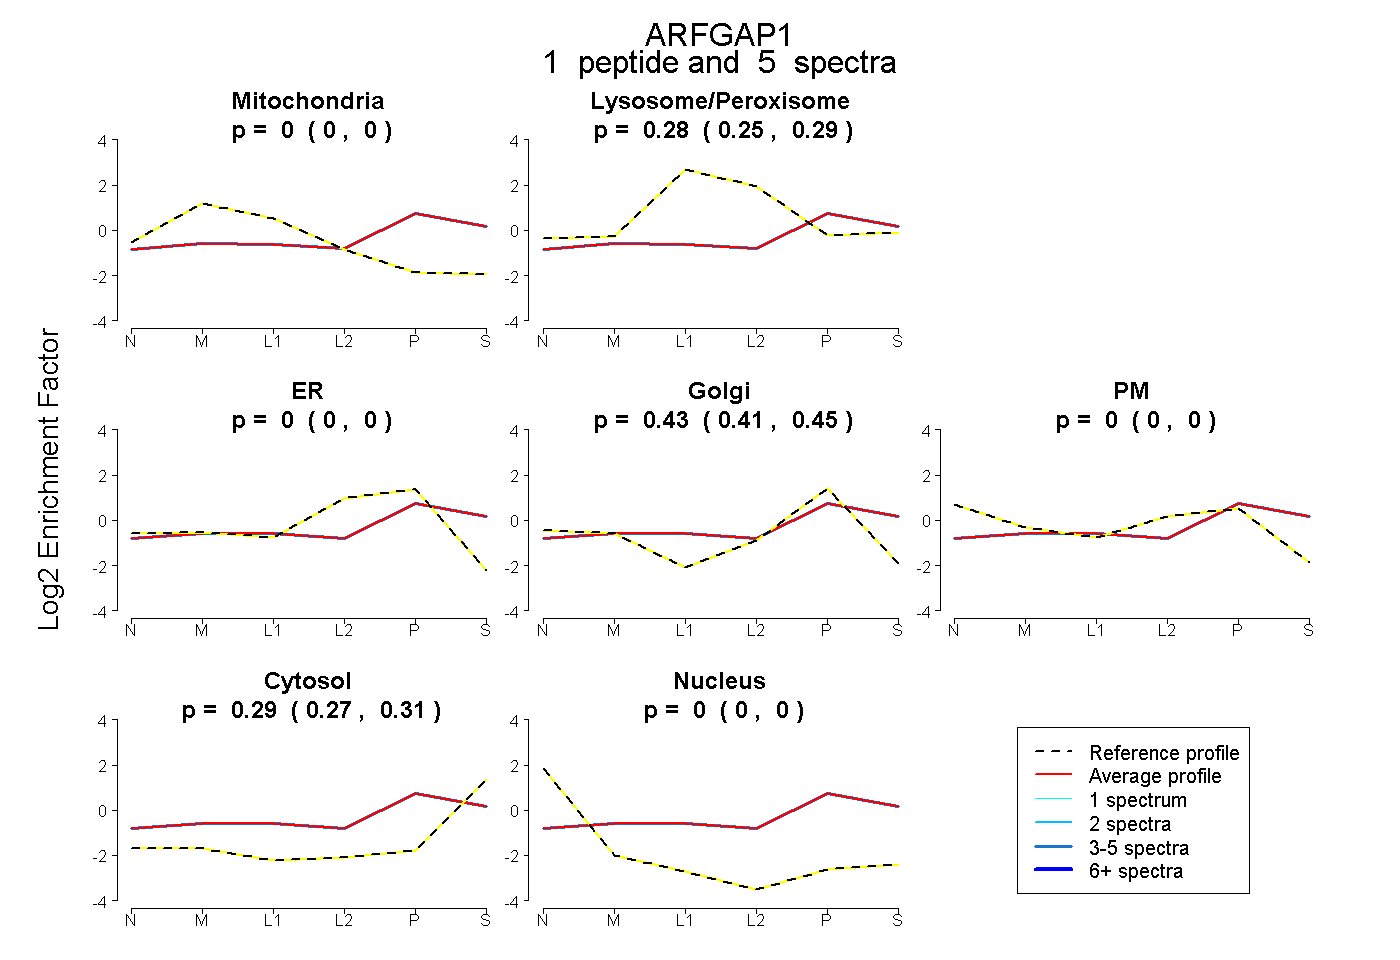 |
0.000 0.000 | 0.000 |
0.276 0.254 | 0.292 |
0.000 0.000 | 0.000 |
0.431 0.408 | 0.452 |
0.000 0.000 | 0.000 |
0.293 0.271 | 0.312 |
0.000 0.000 | 0.000 |
|||
| Plot | Lyso | Other | |||||||||||
| Expt C |
5 peptides |
9 spectra |
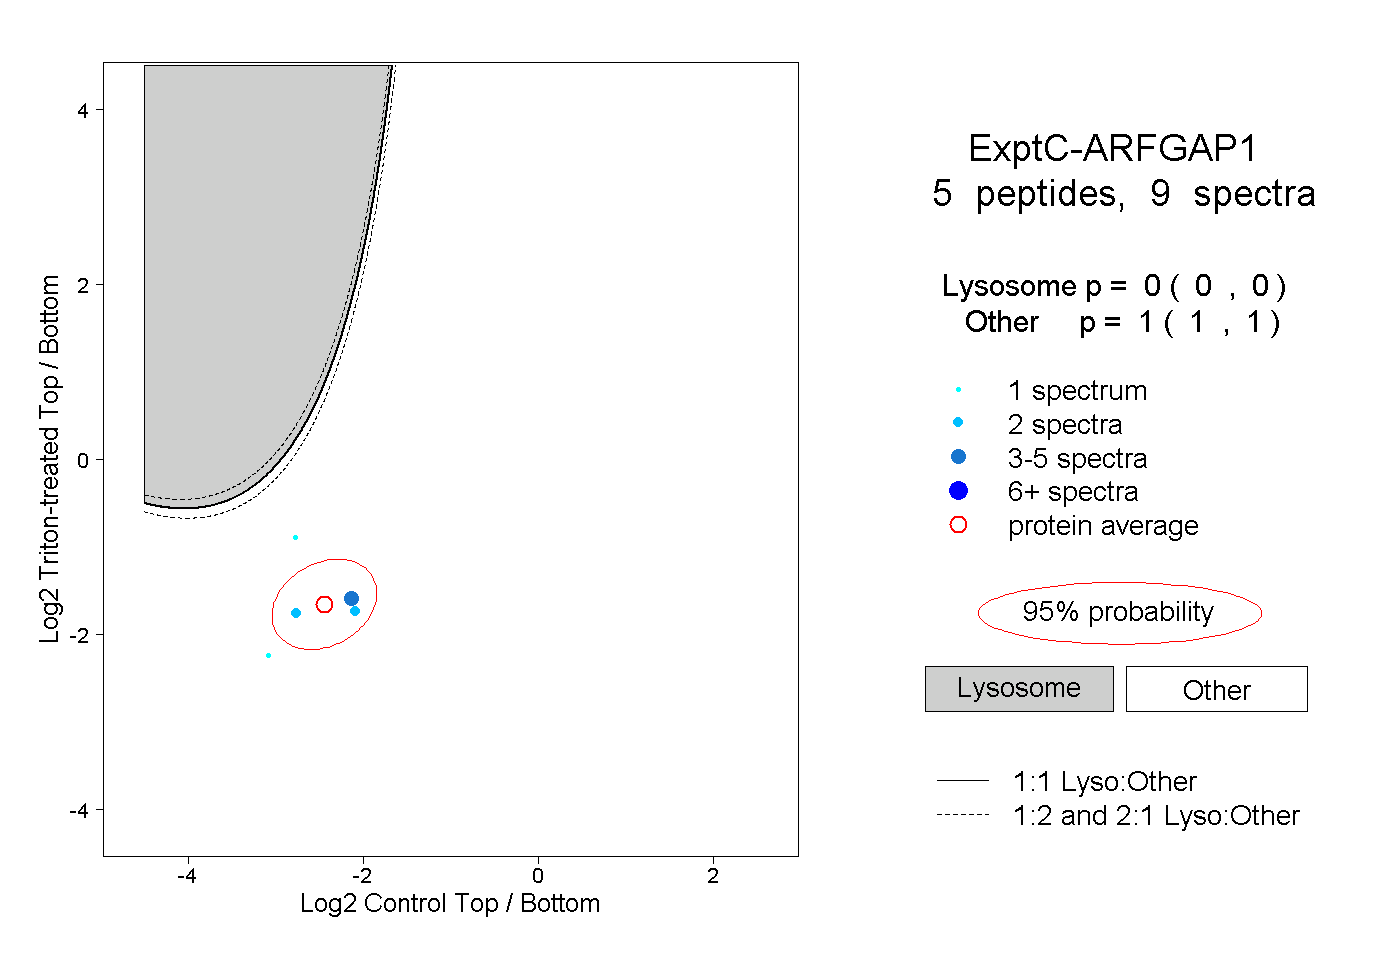 |
0.000 0.000 | 0.000 |
1.000 1.000 | 1.000 |
||||||||
| Plot | Lyso | Other | |||||||||||
| Expt D |
1 peptide |
6 spectra |
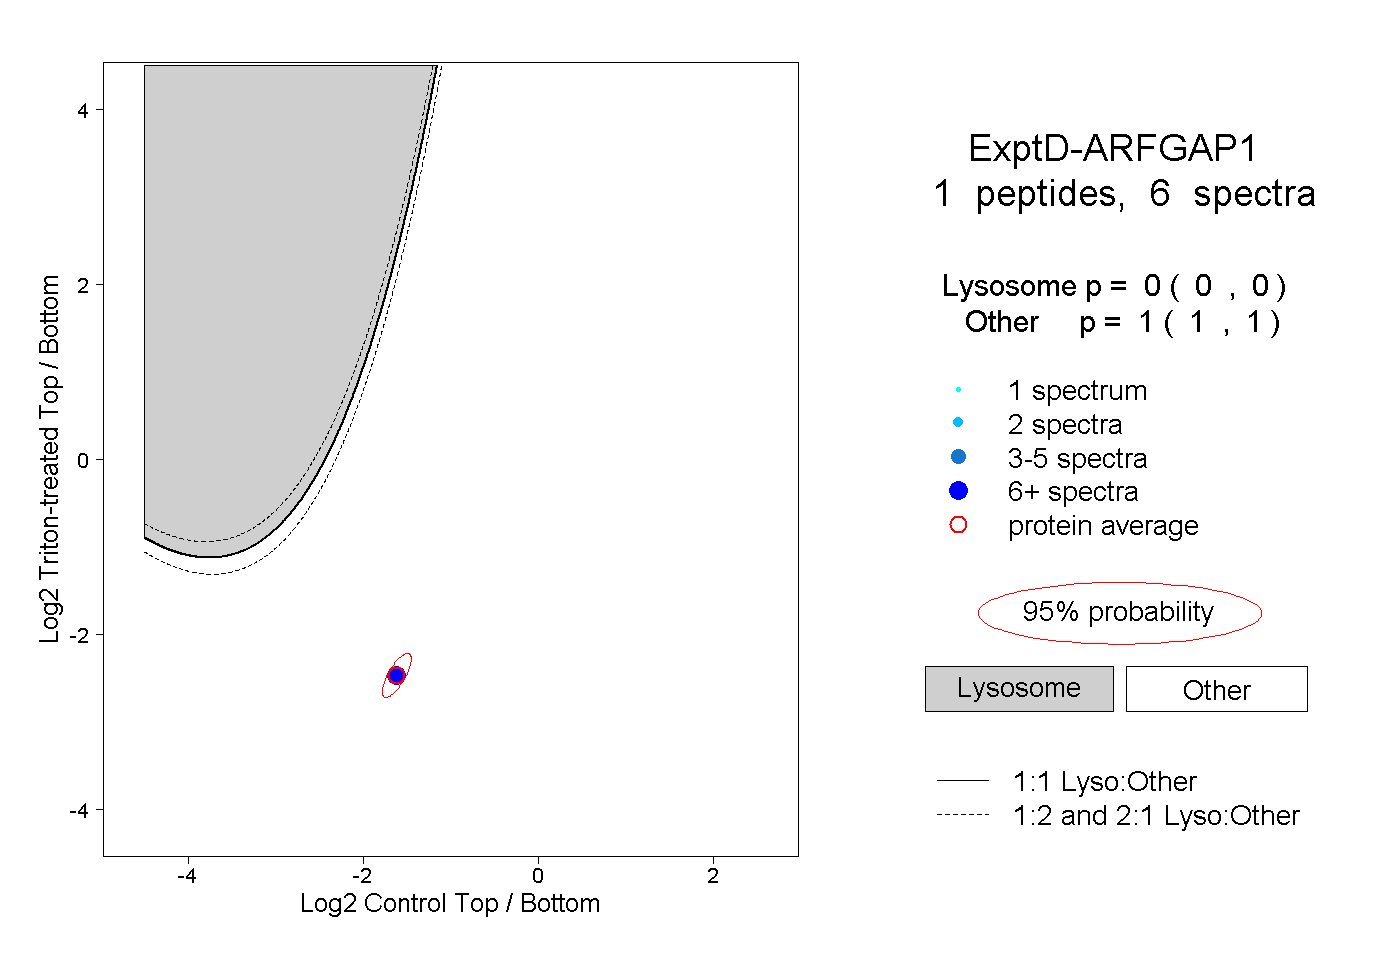 |
0.000 0.000 | 0.000 |
1.000 1.000 | 1.000 |