 4
4peptides
spectra
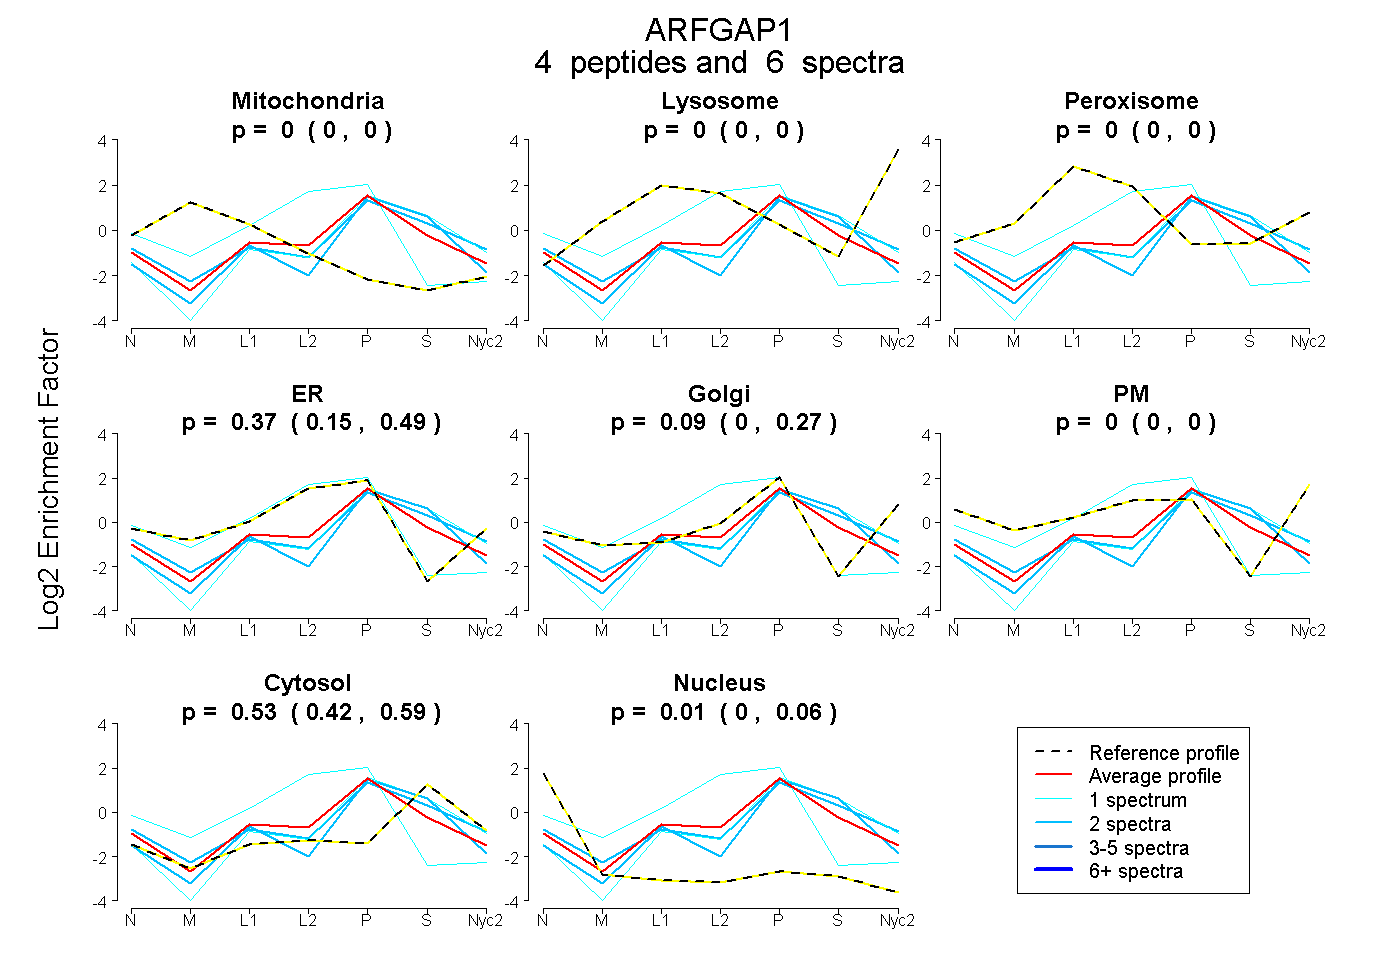
0.000 | 0.000
0.000 | 0.000
0.000 | 0.000
0.150 | 0.490
0.000 | 0.269
0.000 | 0.000
0.421 | 0.591
0.000 | 0.064
1peptide
spectra
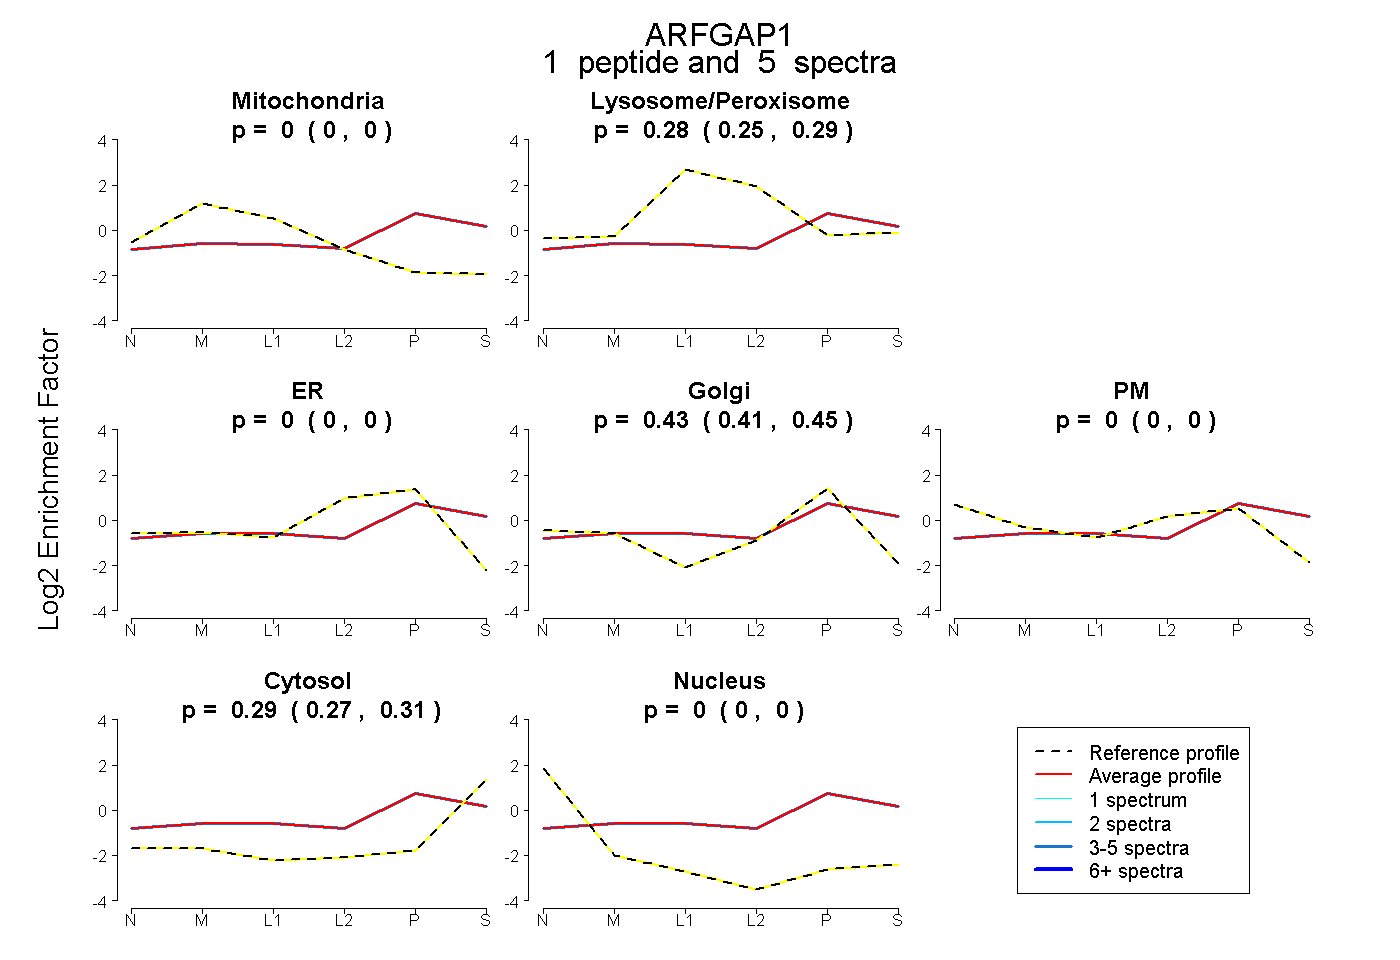
0.000 | 0.000
0.254 | 0.292
0.000 | 0.000
0.408 | 0.452
0.000 | 0.000
0.271 | 0.312
0.000 | 0.000
5peptides
spectra
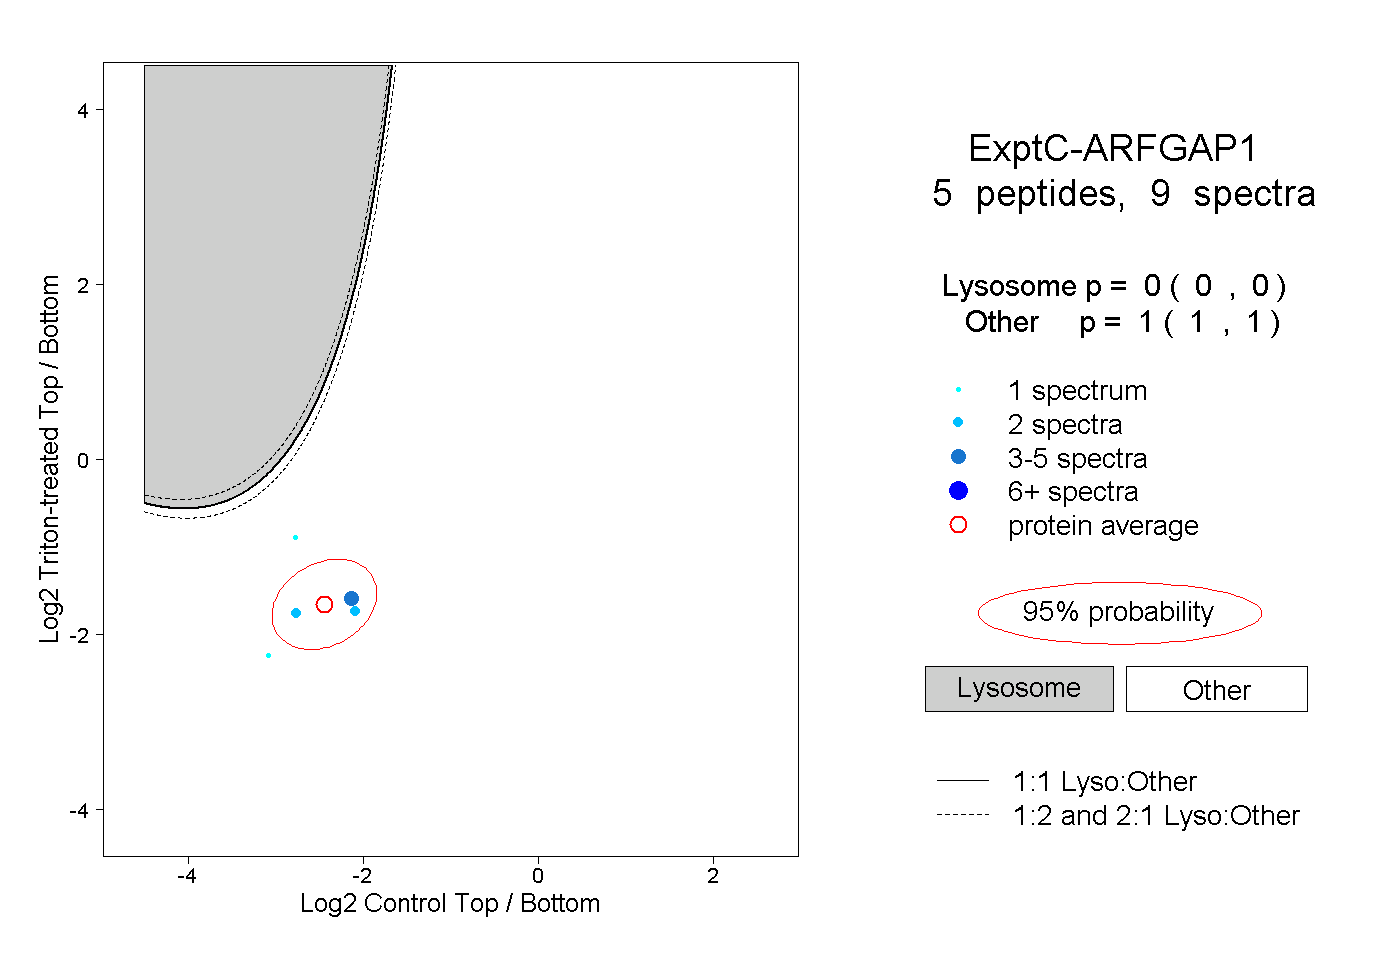
0.000 | 0.000
1.000 | 1.000
1peptide
spectra
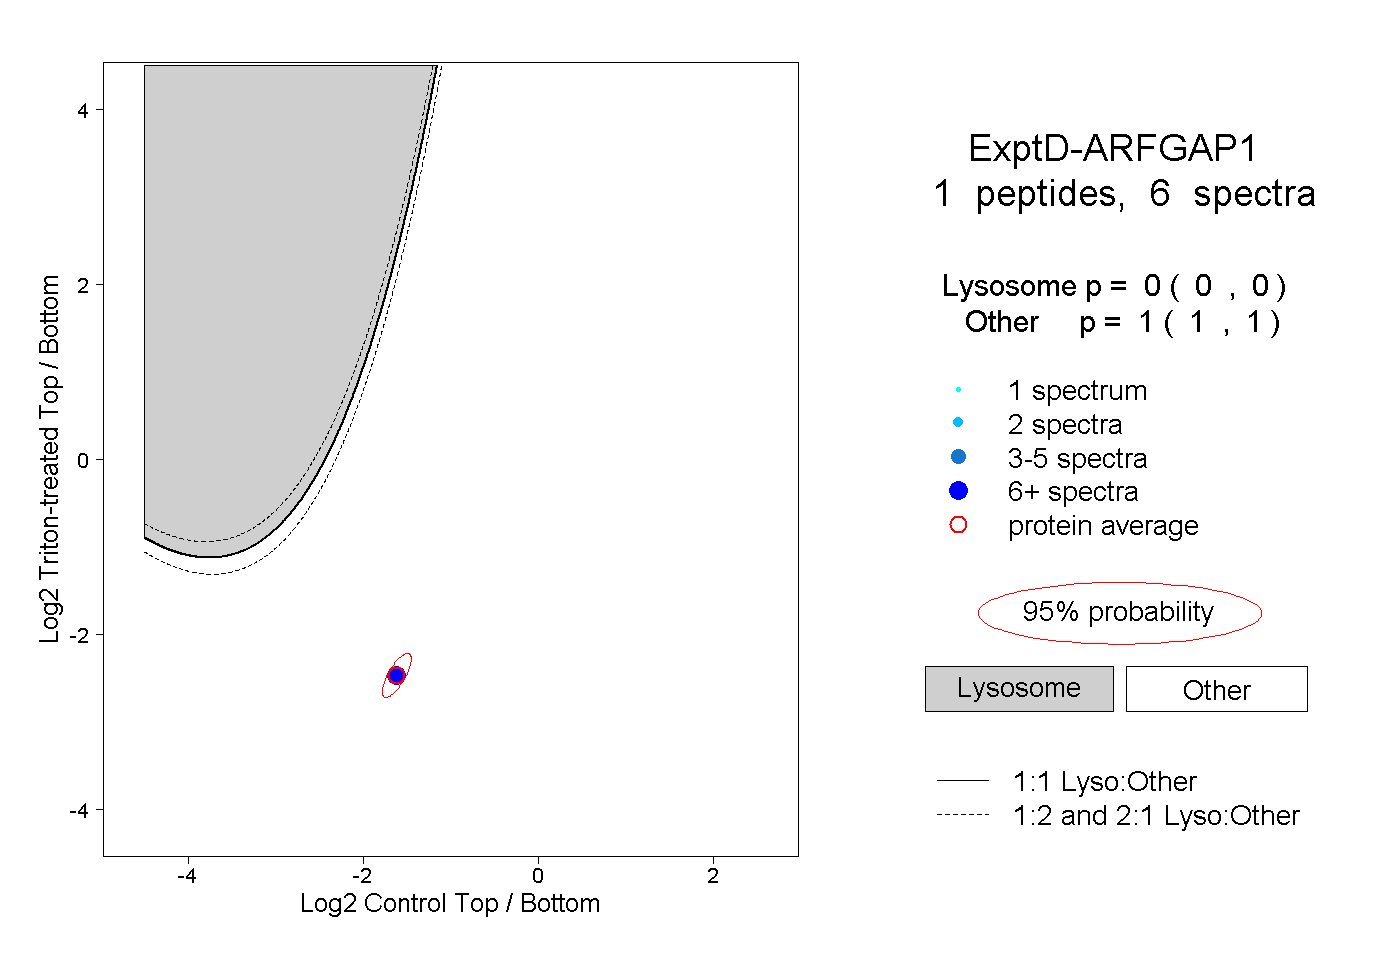
0.000 | 0.000
1.000 | 1.000