 19
19peptides
spectra
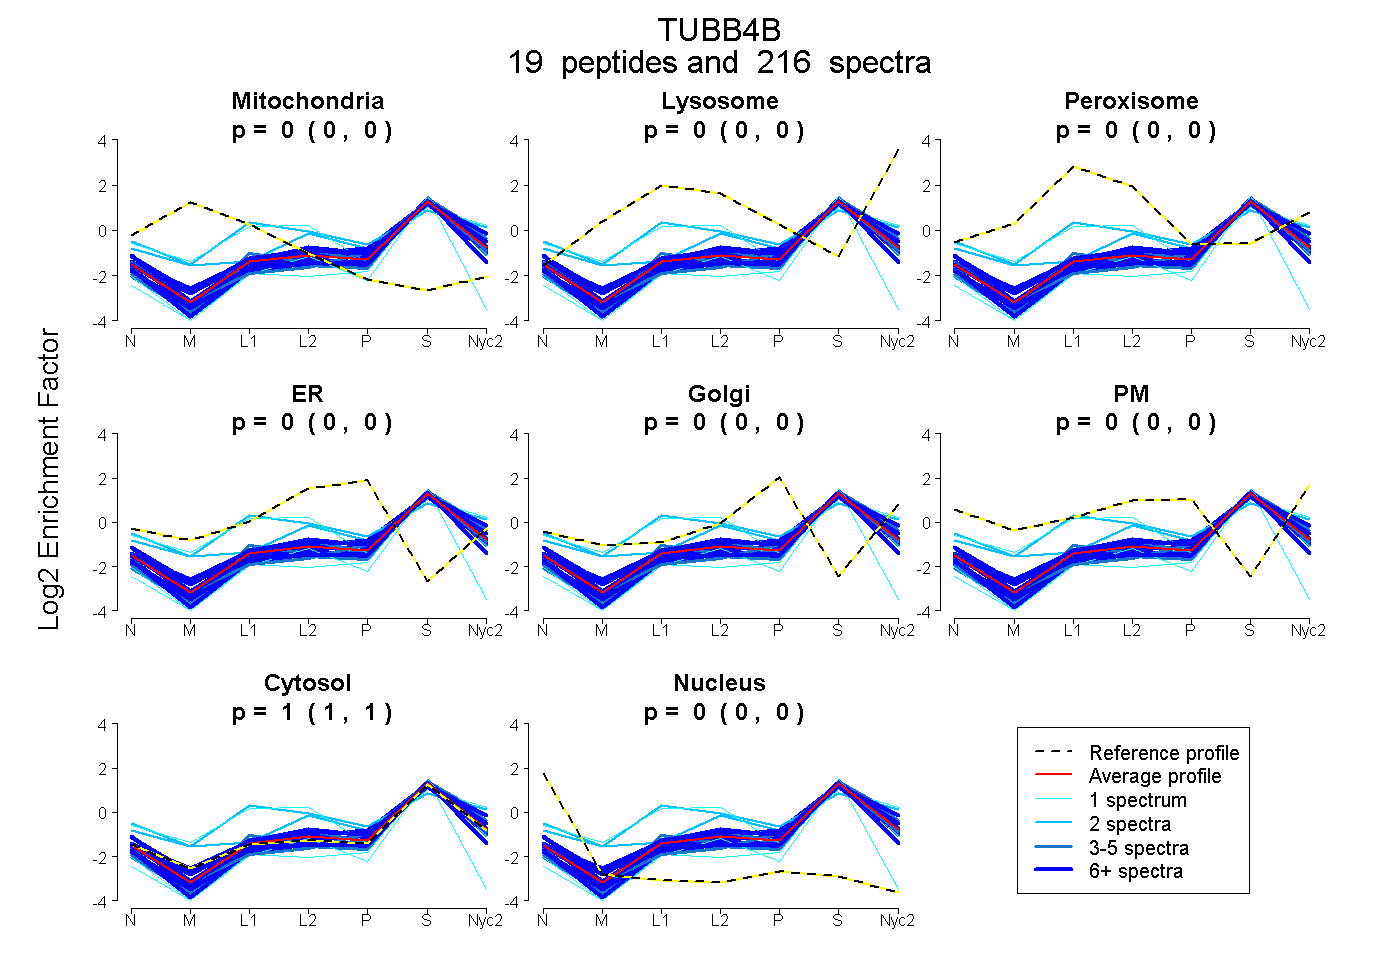
0.000 | 0.000
0.000 | 0.000
0.000 | 0.000
0.000 | 0.000
0.000 | 0.000
0.000 | 0.000
1.000 | 1.000
0.000 | 0.000
17peptides
spectra
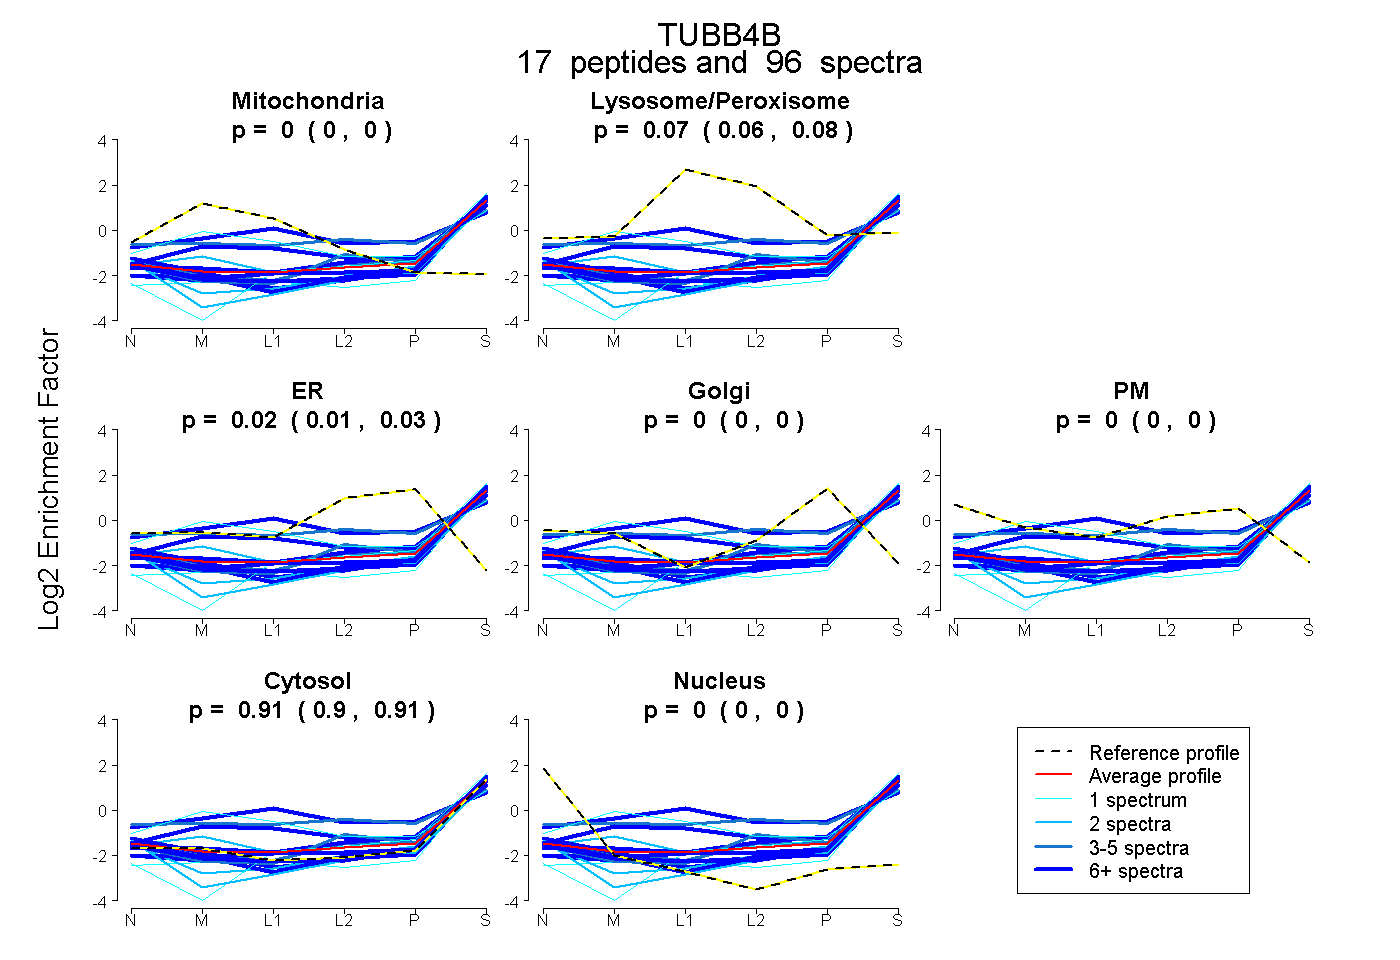
0.000 | 0.000
0.064 | 0.080
0.014 | 0.027
0.000 | 0.000
0.000 | 0.000
0.901 | 0.910
0.000 | 0.000
17peptides
spectra
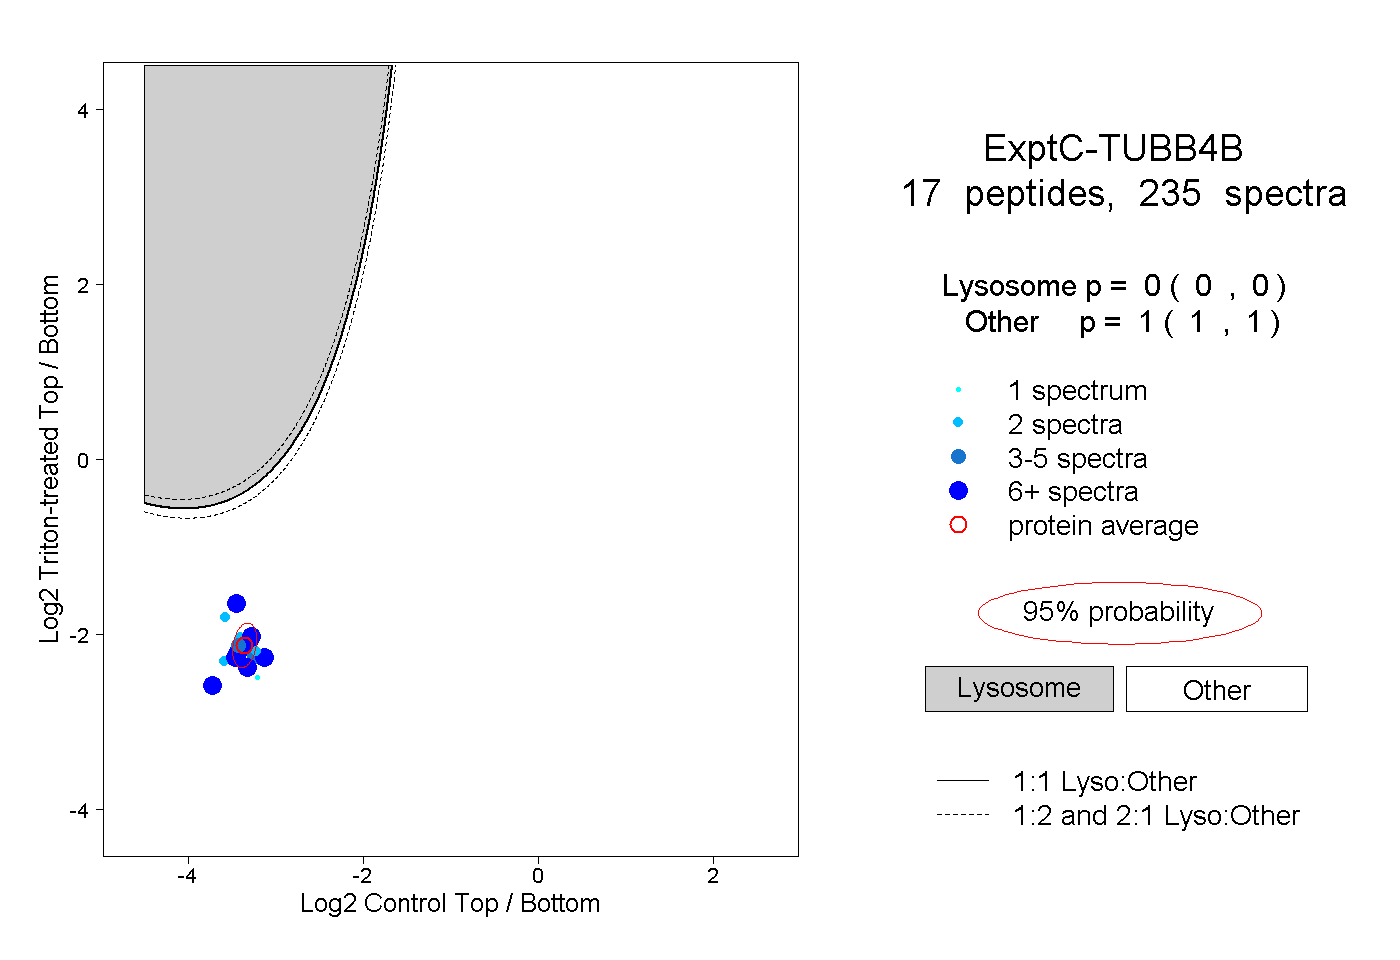
0.000 | 0.000
1.000 | 1.000
4peptides
spectra
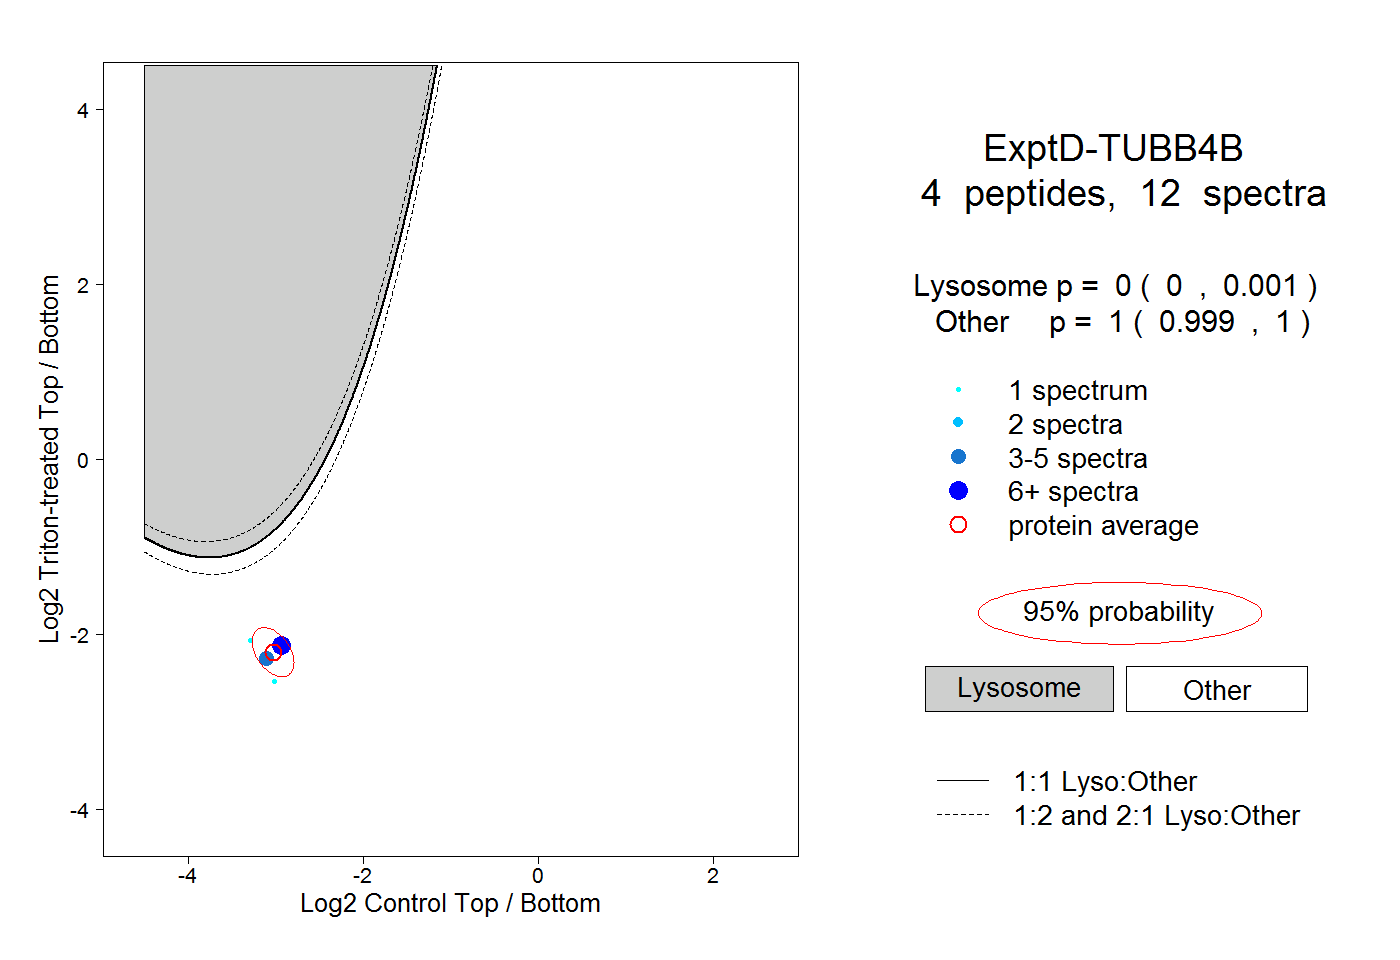
0.000 | 0.001
0.999 | 1.000