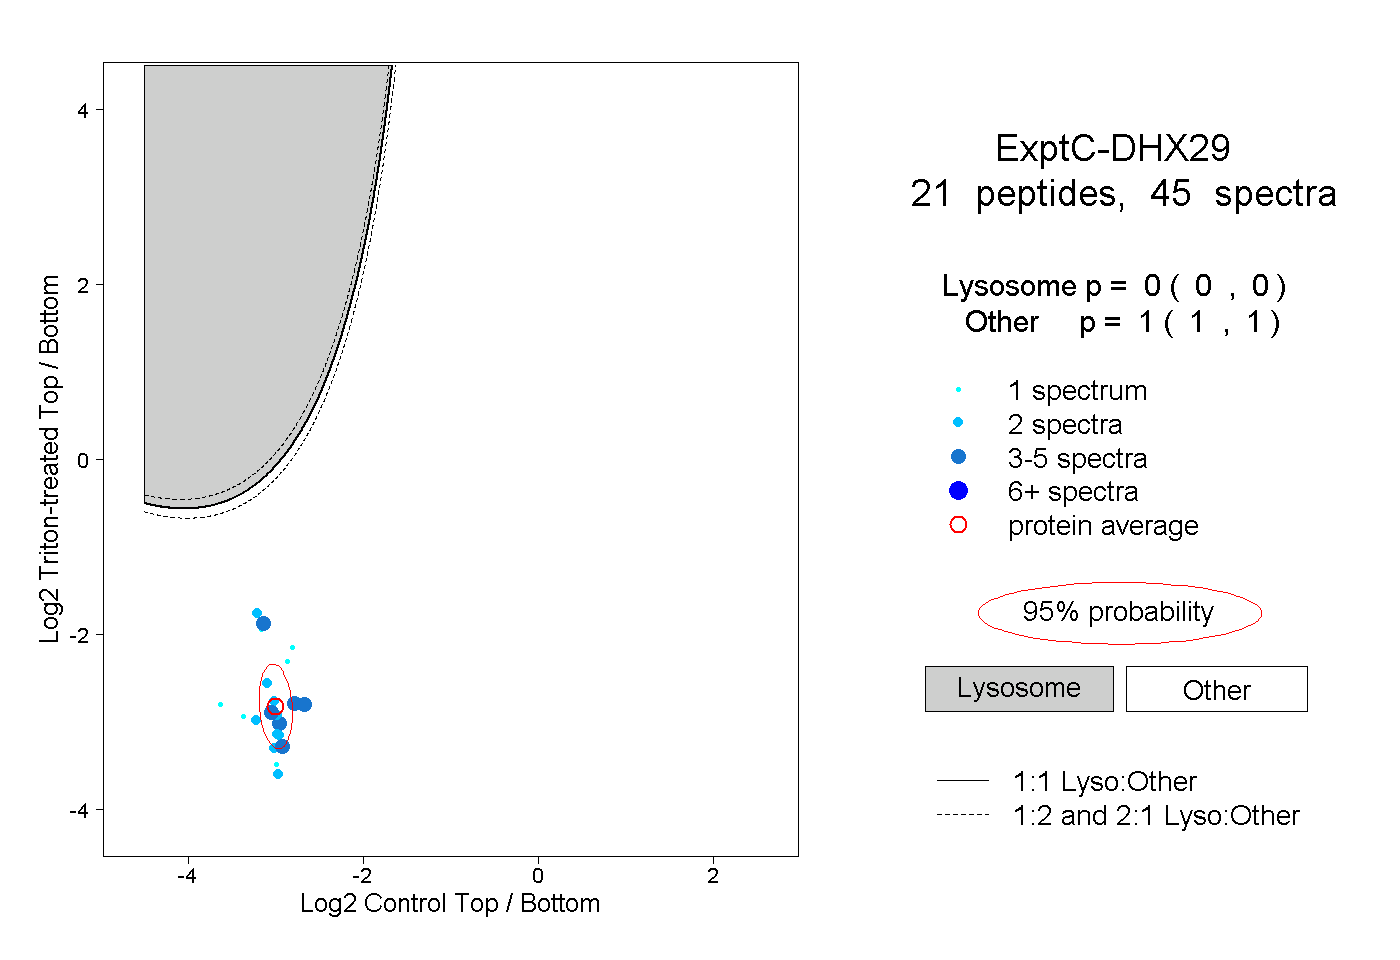
21
21peptides
spectra
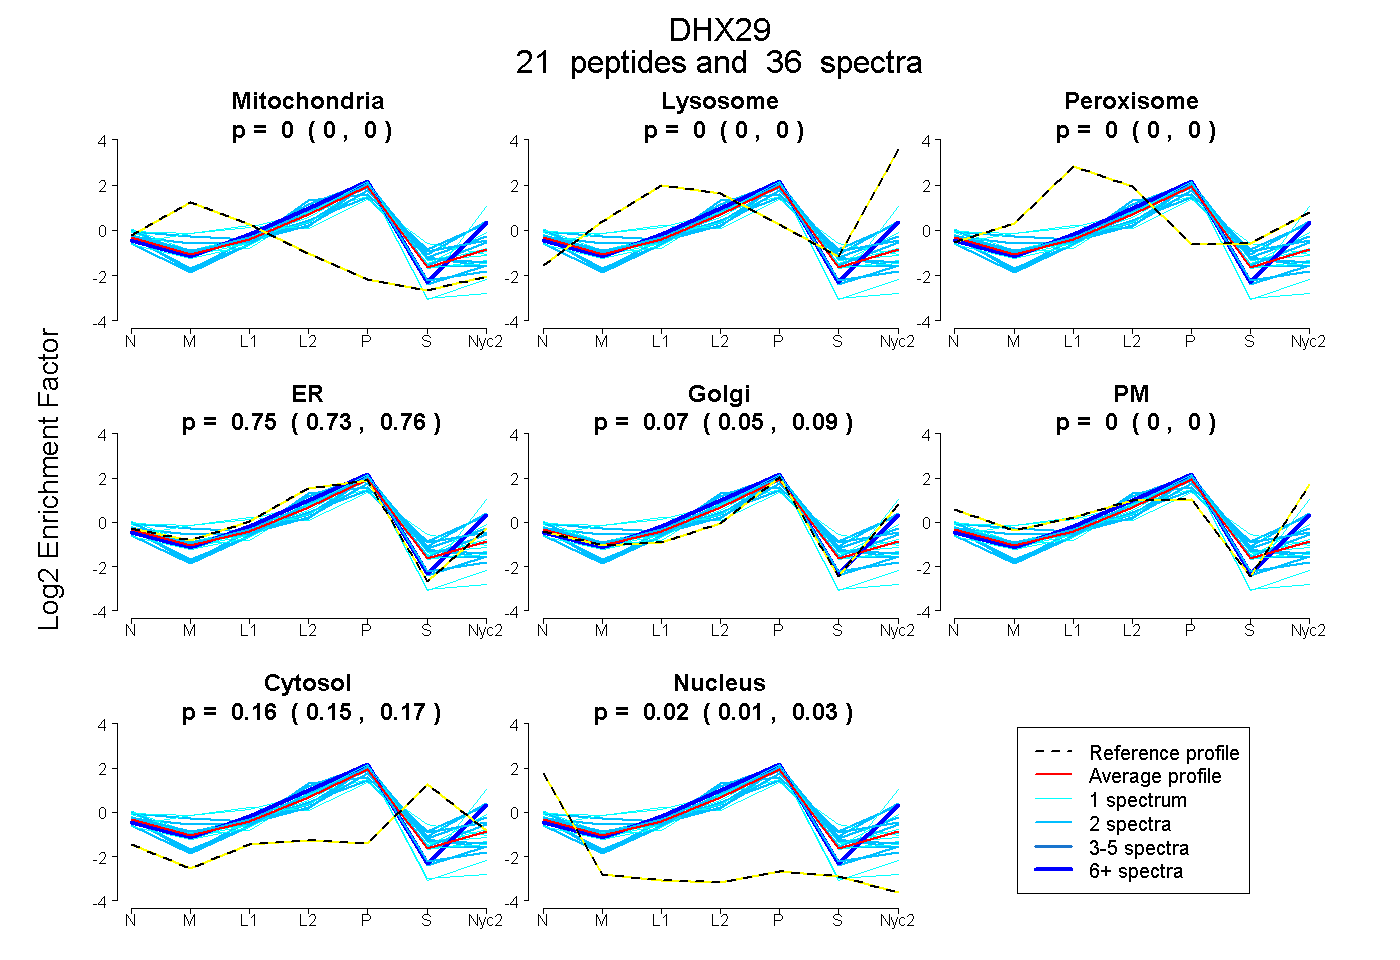
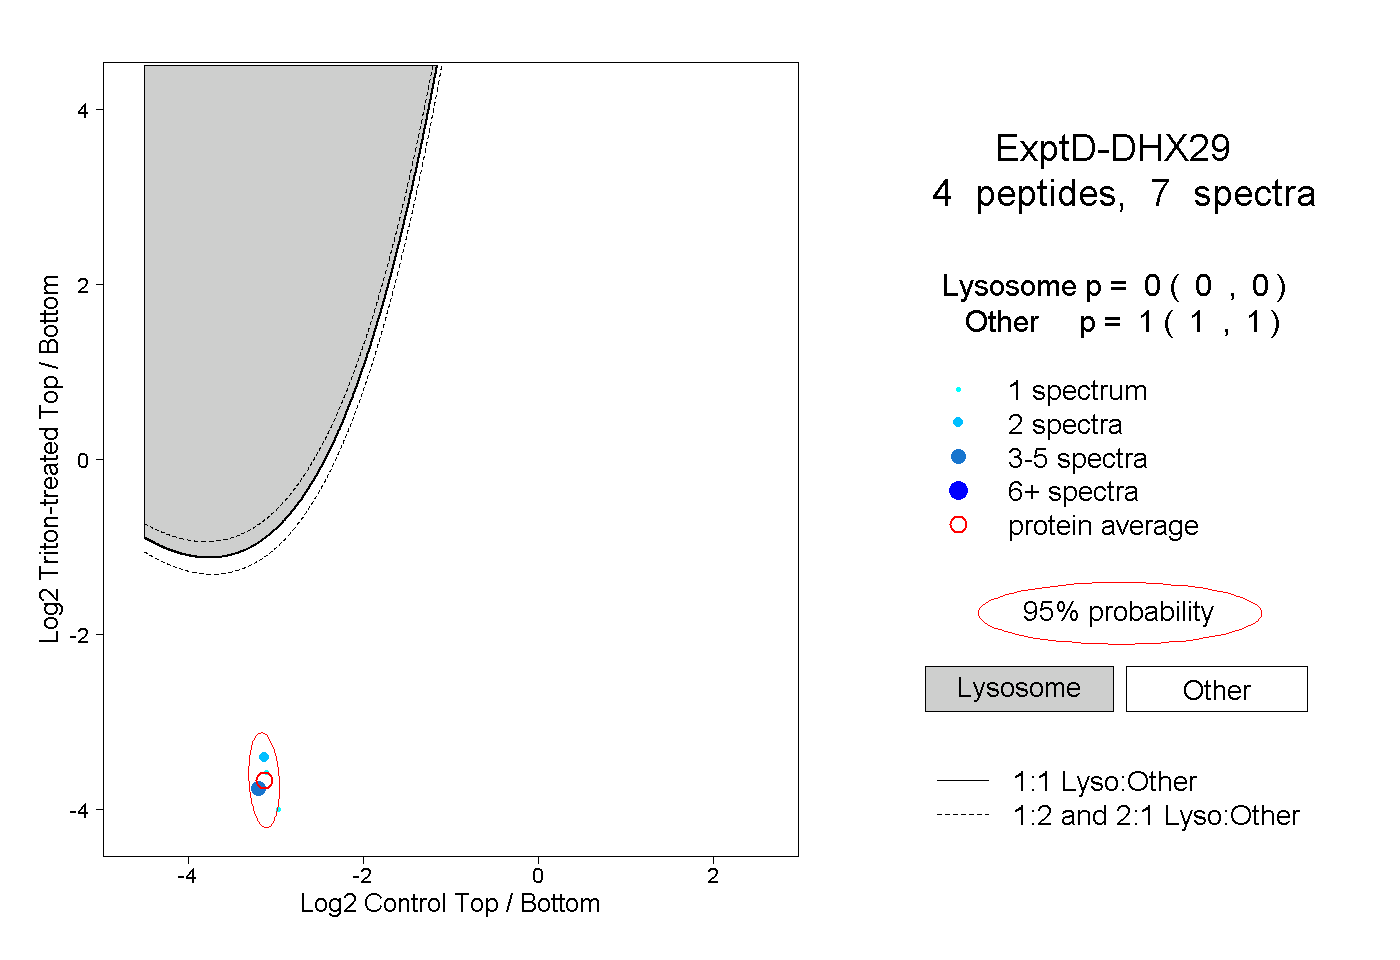
0.000 | 0.000
0.000 | 0.000
0.000 | 0.000
0.726 | 0.762
0.047 | 0.092
0.000 | 0.000
0.154 | 0.171
0.012 | 0.025
6peptides
spectra
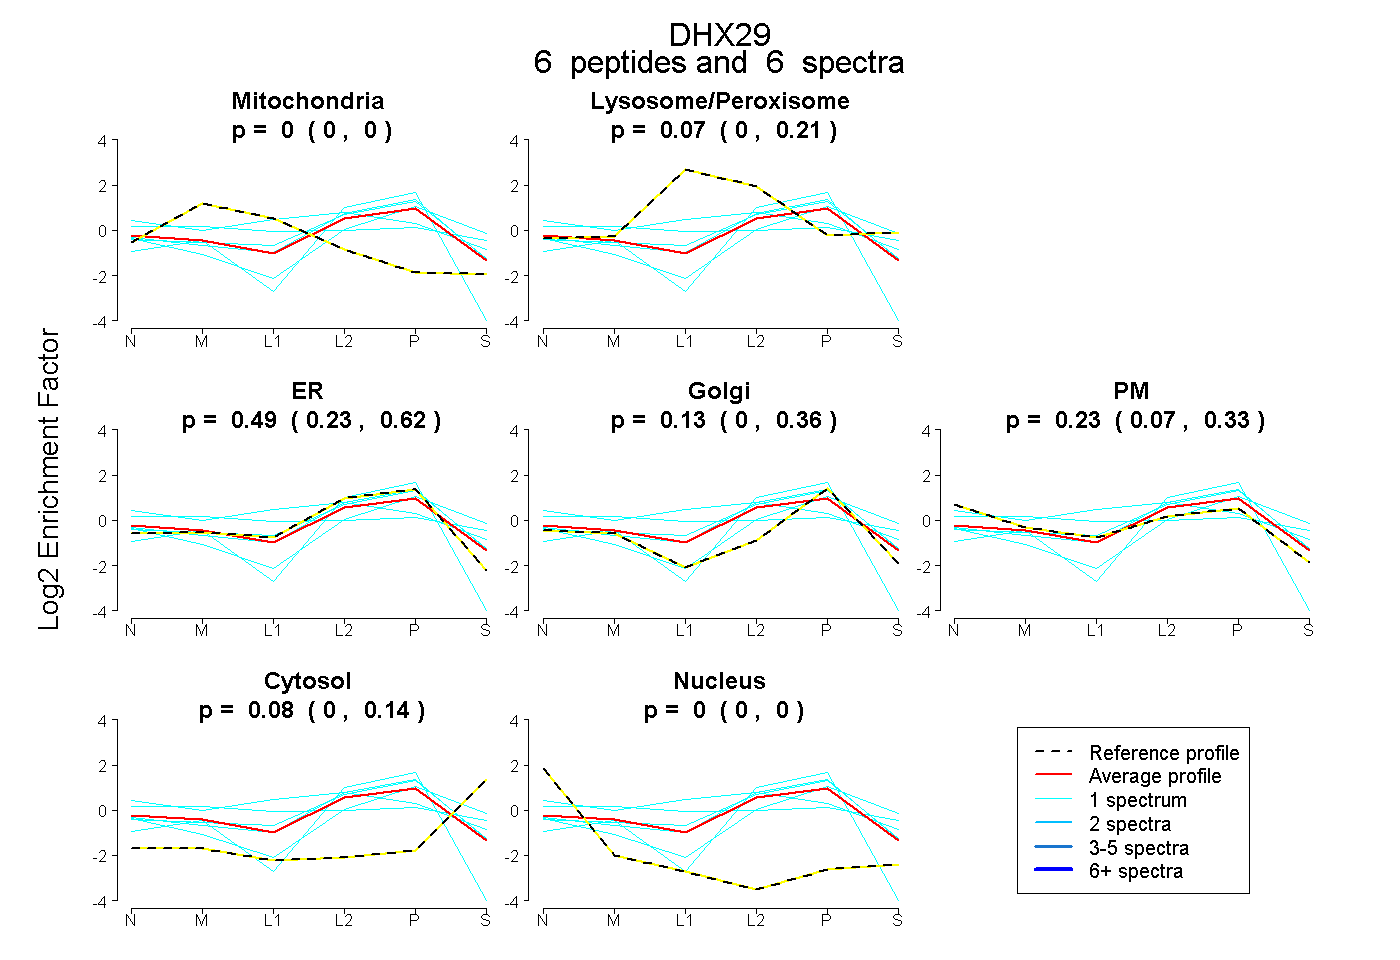
0.000 | 0.000
0.000 | 0.214
0.226 | 0.622
0.000 | 0.358
0.065 | 0.335
0.001 | 0.141
0.000 | 0.000