 21
21peptides
spectra
0.000 | 0.000
0.000 | 0.000
0.000 | 0.000
0.726 | 0.762
0.047 | 0.092
0.000 | 0.000
0.154 | 0.171
0.012 | 0.025
| Plot | Mito | Lyso | Perox | ER | Golgi | PM | Cytosol | Nucleus | |||||
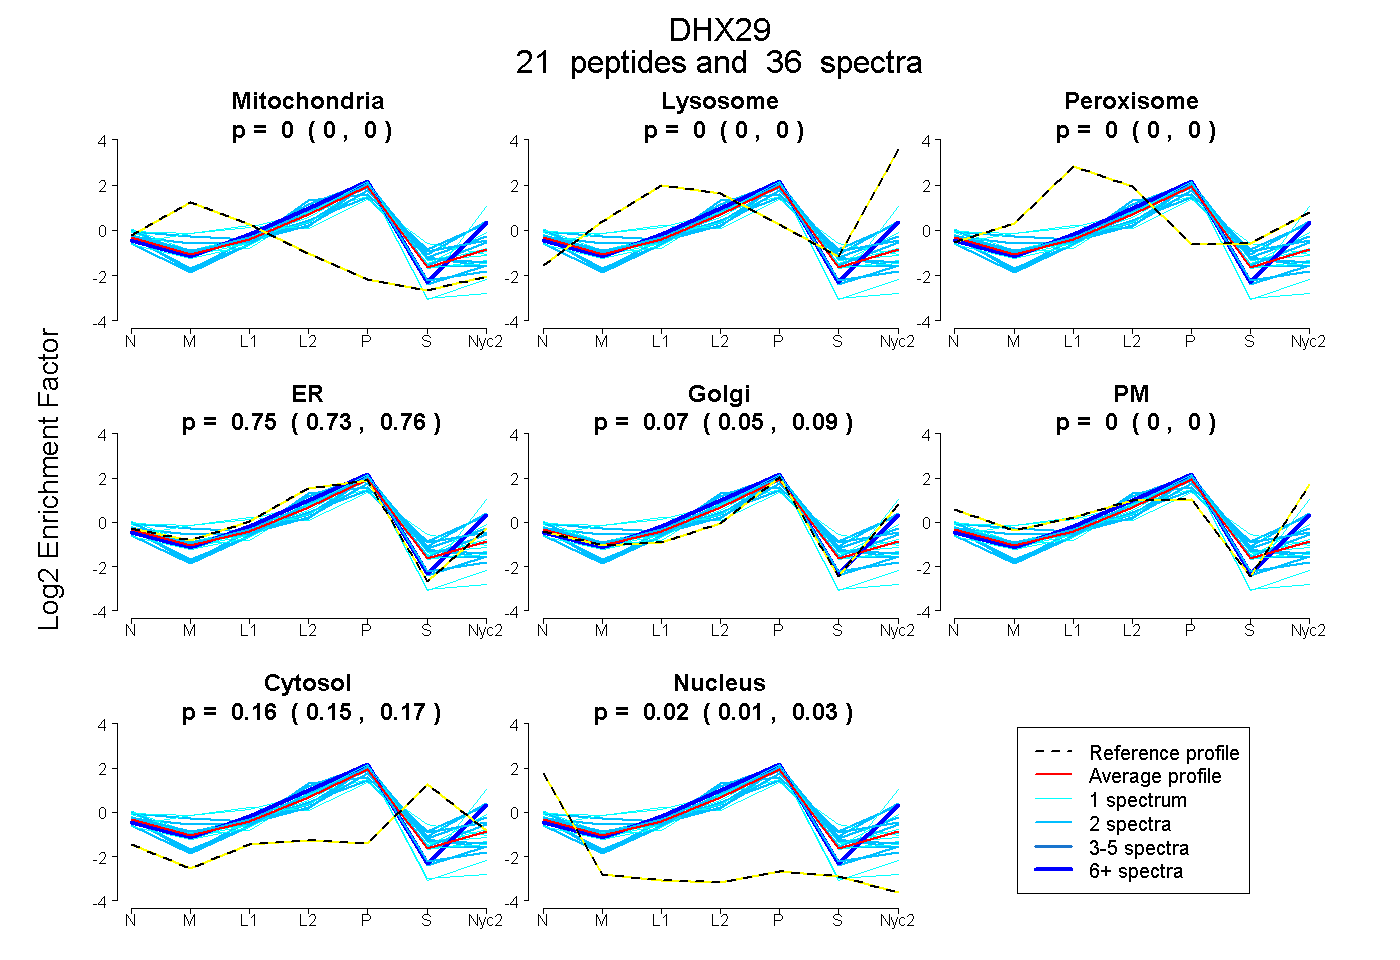
| Expt A |
21 peptides |
36 spectra |
|
0.000 0.000 | 0.000 |
0.000 0.000 | 0.000 |
0.000 0.000 | 0.000 |
0.746 0.726 | 0.762 |
0.072 0.047 | 0.092 |
0.000 0.000 | 0.000 |
0.164 0.154 | 0.171 |
0.019 0.012 | 0.025 |
| 1 spectrum, EQAAAFK | 0.000 | 0.000 | 0.000 | 0.671 | 0.120 | 0.000 | 0.170 | 0.039 | ||
| 1 spectrum, CDLGSPEDFLSK | 0.000 | 0.000 | 0.000 | 0.844 | 0.000 | 0.000 | 0.000 | 0.156 | ||
| 2 spectra, ISAVSLATR | 0.000 | 0.000 | 0.000 | 0.735 | 0.000 | 0.000 | 0.250 | 0.016 | ||
| 2 spectra, QFLIDWVR | 0.000 | 0.000 | 0.000 | 0.732 | 0.000 | 0.000 | 0.227 | 0.041 | ||
| 1 spectrum, FSTYFTHCPILR | 0.098 | 0.000 | 0.113 | 0.504 | 0.030 | 0.000 | 0.256 | 0.000 | ||
| 1 spectrum, VLIDSVLR | 0.000 | 0.000 | 0.000 | 0.792 | 0.000 | 0.000 | 0.169 | 0.039 | ||
| 2 spectra, AQQEGGFR | 0.067 | 0.000 | 0.089 | 0.370 | 0.334 | 0.000 | 0.140 | 0.000 | ||
| 1 spectrum, IAVIFK | 0.000 | 0.089 | 0.000 | 0.261 | 0.640 | 0.010 | 0.000 | 0.000 | ||
| 1 spectrum, LQSTPK | 0.000 | 0.000 | 0.000 | 0.764 | 0.018 | 0.000 | 0.218 | 0.000 | ||
| 2 spectra, APGAAAMR | 0.000 | 0.017 | 0.000 | 0.280 | 0.510 | 0.000 | 0.193 | 0.000 | ||
| 2 spectra, CNIVCTQPR | 0.000 | 0.000 | 0.000 | 0.914 | 0.000 | 0.000 | 0.005 | 0.081 | ||
| 2 spectra, DSEYCQK | 0.000 | 0.000 | 0.000 | 0.792 | 0.000 | 0.000 | 0.125 | 0.083 | ||
| 2 spectra, VVINNK | 0.000 | 0.000 | 0.000 | 0.811 | 0.000 | 0.000 | 0.038 | 0.150 | ||
| 2 spectra, QHPENK | 0.000 | 0.000 | 0.000 | 0.624 | 0.193 | 0.000 | 0.182 | 0.002 | ||
| 1 spectrum, QQLPVFK | 0.058 | 0.000 | 0.185 | 0.418 | 0.296 | 0.000 | 0.042 | 0.000 | ||
| 2 spectra, EPHDVR | 0.000 | 0.104 | 0.000 | 0.573 | 0.051 | 0.077 | 0.194 | 0.000 | ||
| 1 spectrum, DLQTYGWLLYQEK | 0.000 | 0.000 | 0.000 | 0.801 | 0.000 | 0.000 | 0.141 | 0.058 | ||
| 6 spectra, SPFITPIGR | 0.000 | 0.032 | 0.000 | 0.566 | 0.393 | 0.000 | 0.008 | 0.000 | ||
| 2 spectra, SPNPSFEK | 0.000 | 0.000 | 0.001 | 0.487 | 0.260 | 0.000 | 0.252 | 0.000 | ||
| 1 spectrum, LLYCTTGVLLR | 0.000 | 0.000 | 0.000 | 0.801 | 0.000 | 0.000 | 0.000 | 0.199 | ||
| 1 spectrum, NSLCGYQIR | 0.000 | 0.000 | 0.000 | 0.778 | 0.000 | 0.000 | 0.221 | 0.001 |
| Plot | Mito | Lyso or Perox | ER | Golgi | PM | Cytosol | Nucleus | ||||||
| Expt B |
6 peptides |
6 spectra |
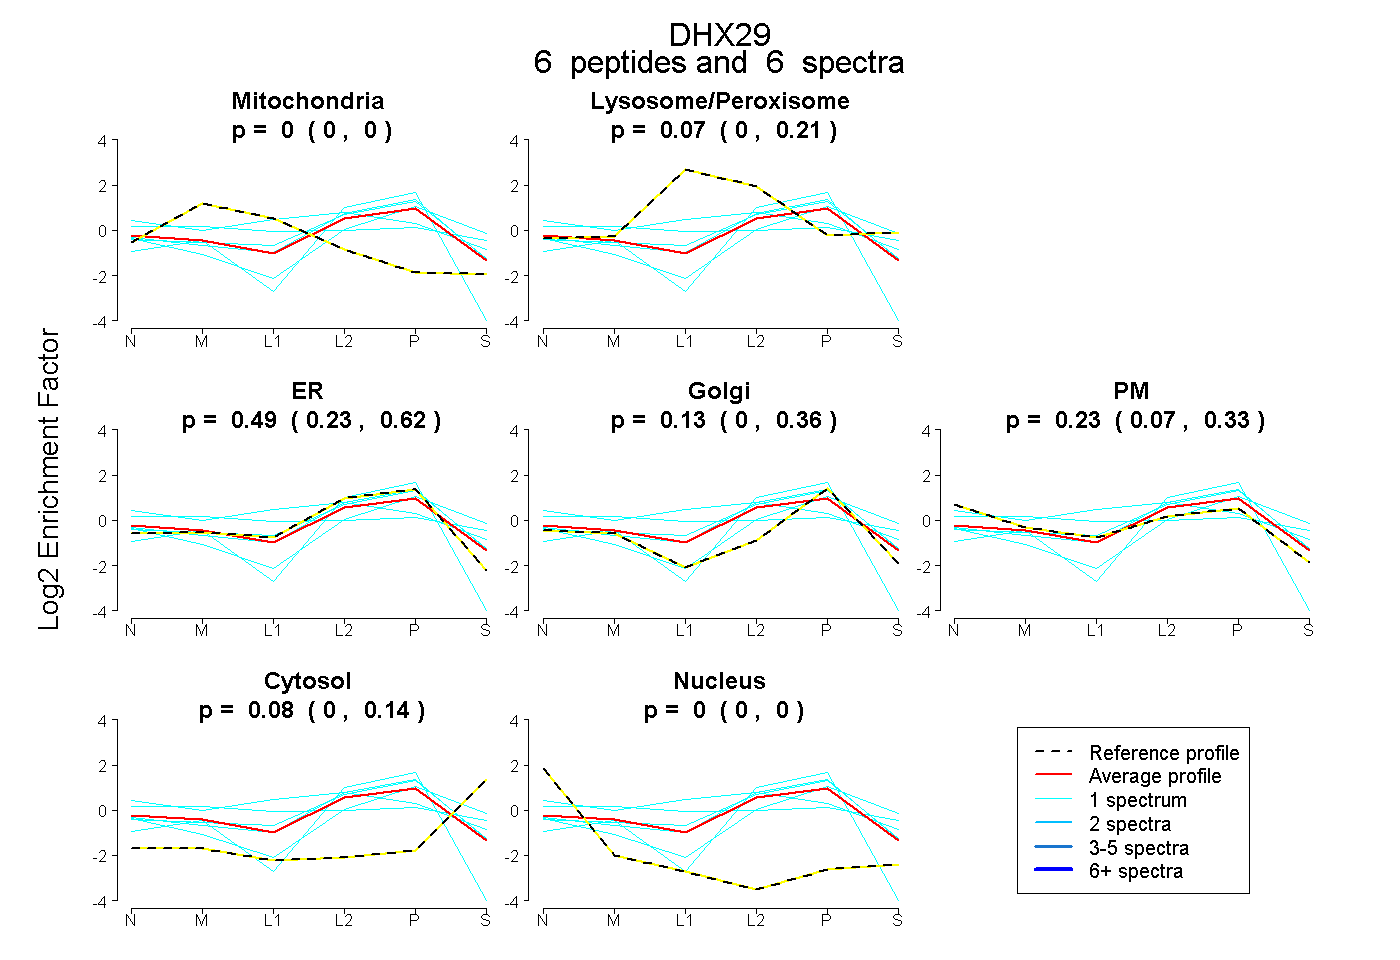 |
0.000 0.000 | 0.000 |
0.071 0.000 | 0.214 |
0.488 0.226 | 0.622 |
0.131 0.000 | 0.358 |
0.226 0.065 | 0.335 |
0.084 0.001 | 0.141 |
0.000 0.000 | 0.000 |
|||
| Plot | Lyso | Other | |||||||||||
| Expt C |
21 peptides |
45 spectra |
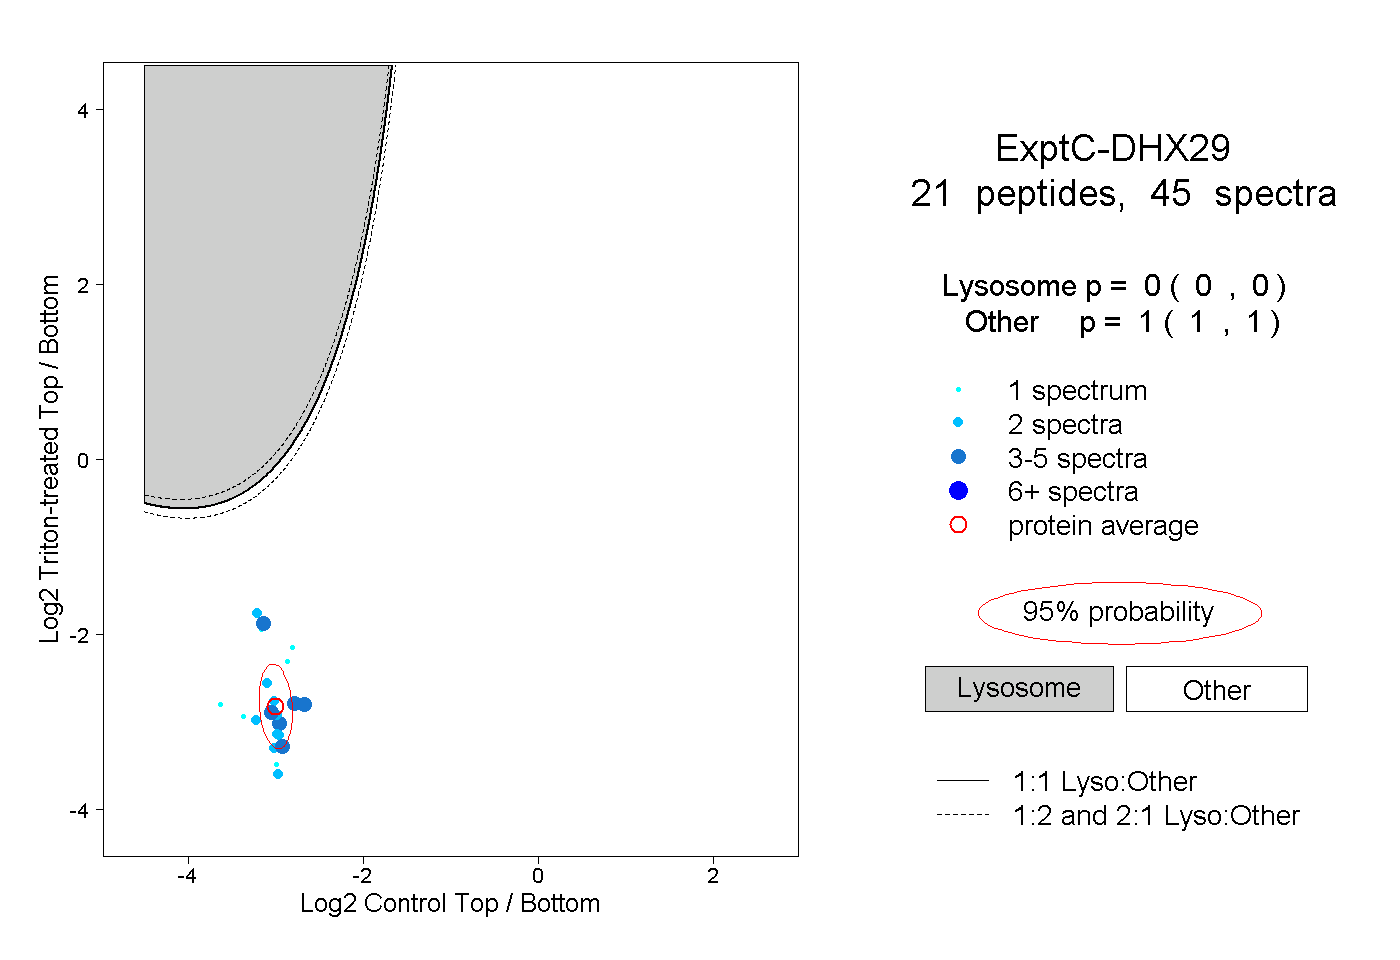 |
0.000 0.000 | 0.000 |
1.000 1.000 | 1.000 |
||||||||
| Plot | Lyso | Other | |||||||||||
| Expt D |
4 peptides |
7 spectra |
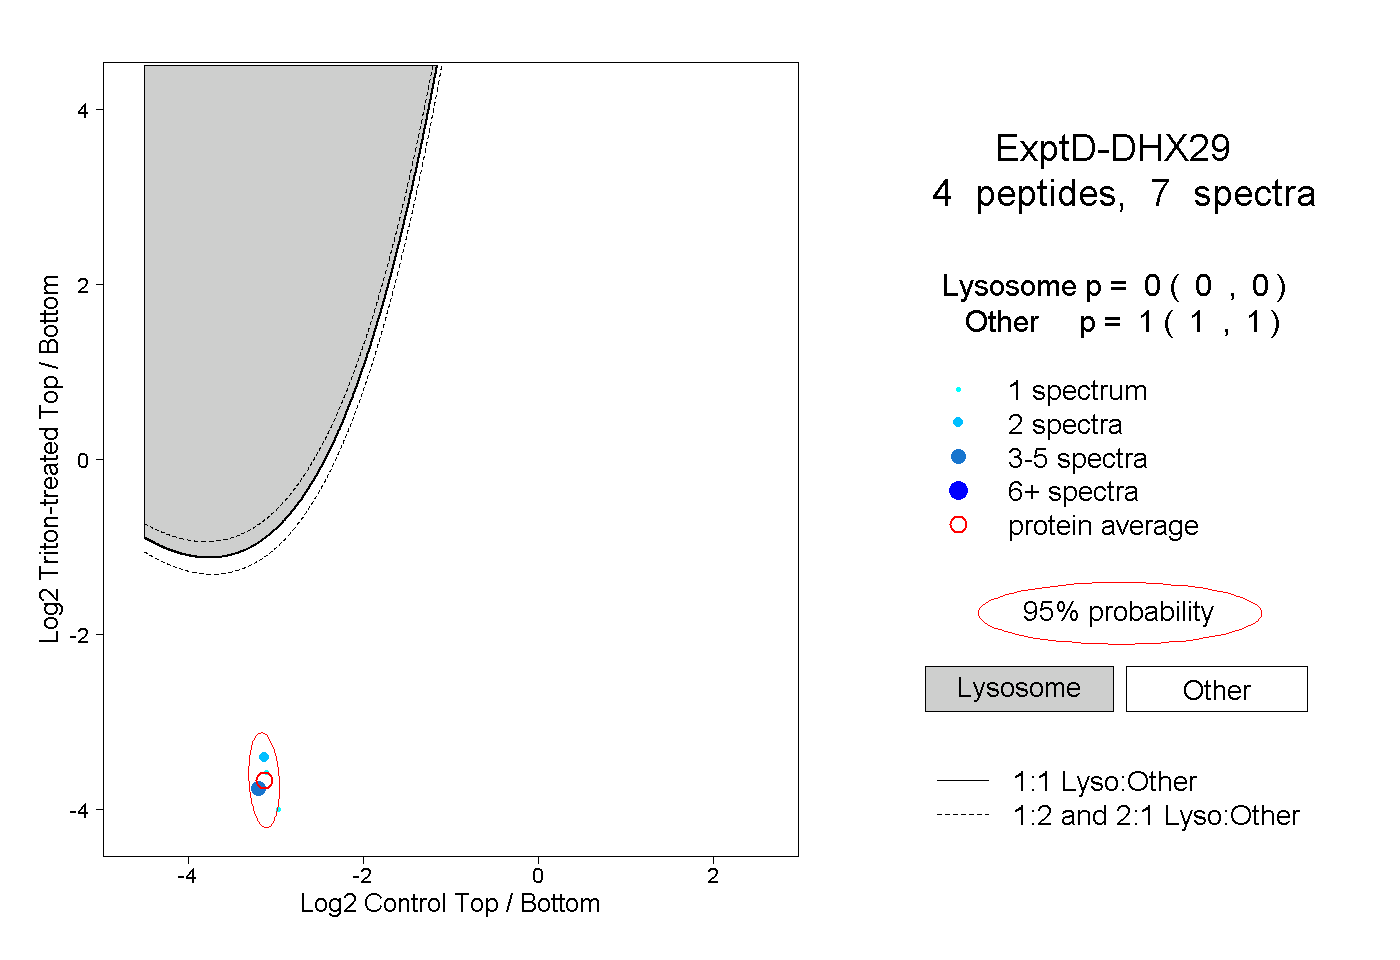 |
0.000 0.000 | 0.000 |
1.000 1.000 | 1.000 |