 11
11peptides
spectra
0.000 | 0.000
0.000 | 0.000
0.000 | 0.000
0.000 | 0.000
0.000 | 0.000
0.154 | 0.178
0.683 | 0.700
0.128 | 0.149
| Plot | Mito | Lyso | Perox | ER | Golgi | PM | Cytosol | Nucleus | |||||
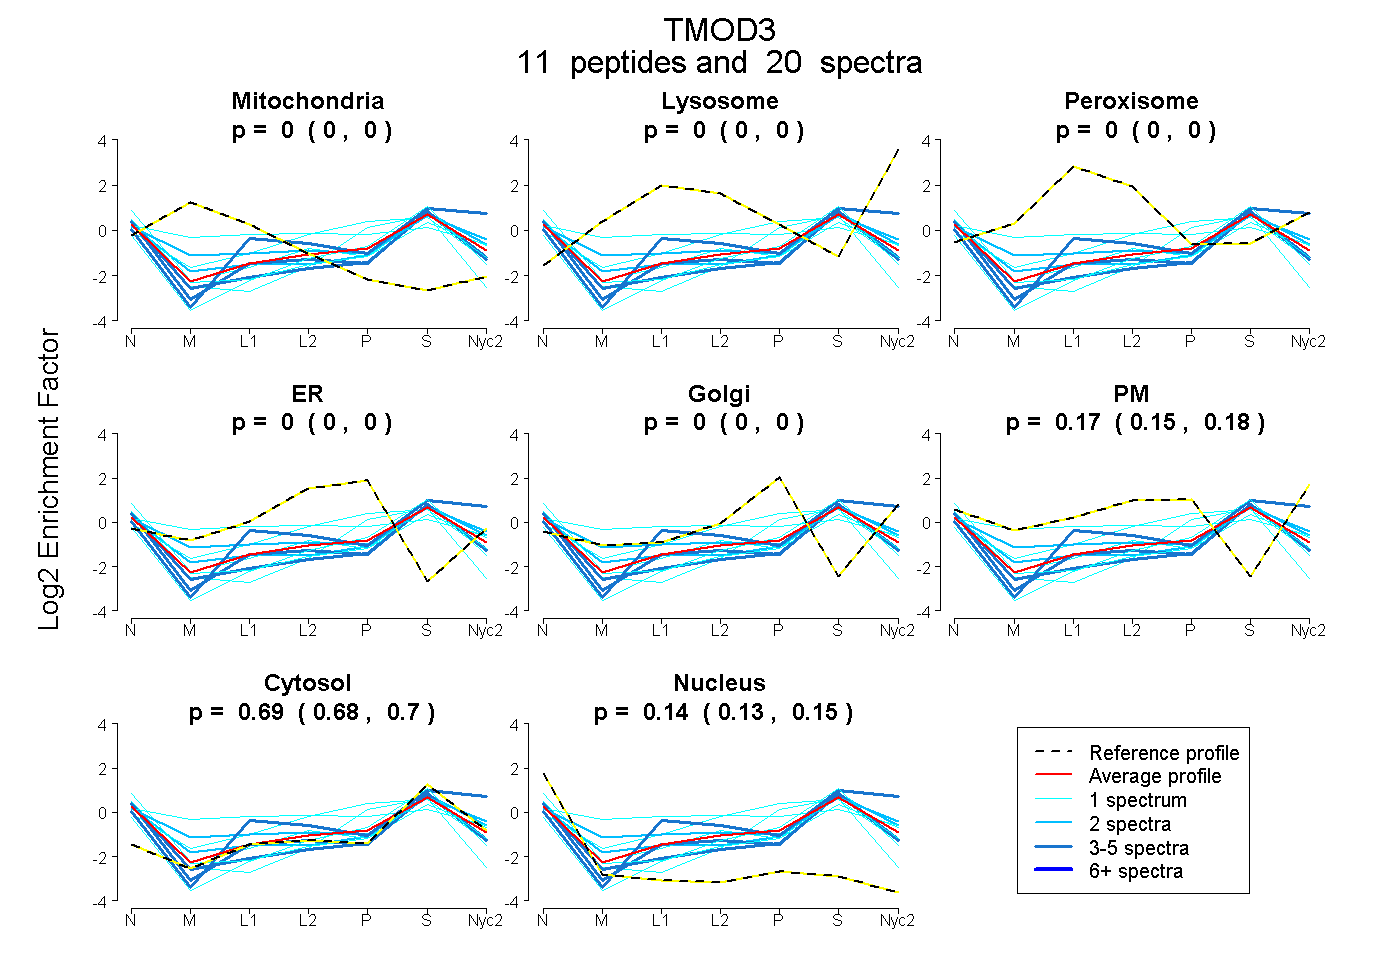
| Expt A |
11 peptides |
20 spectra |
|
0.000 0.000 | 0.000 |
0.000 0.000 | 0.000 |
0.000 0.000 | 0.000 |
0.000 0.000 | 0.000 |
0.000 0.000 | 0.000 |
0.168 0.154 | 0.178 |
0.692 0.683 | 0.700 |
0.140 0.128 | 0.149 |
| 1 spectrum, HFSLAATR | 0.000 | 0.000 | 0.000 | 0.365 | 0.000 | 0.000 | 0.606 | 0.029 | ||
| 3 spectra, LSESELK | 0.000 | 0.000 | 0.019 | 0.000 | 0.000 | 0.034 | 0.740 | 0.208 | ||
| 3 spectra, SNDPVAAAFADMLK | 0.000 | 0.065 | 0.000 | 0.000 | 0.000 | 0.176 | 0.759 | 0.000 | ||
| 1 spectrum, NIPIPTLK | 0.000 | 0.000 | 0.000 | 0.000 | 0.000 | 0.075 | 0.683 | 0.242 | ||
| 4 spectra, LGYQFTQQGPR | 0.000 | 0.000 | 0.000 | 0.000 | 0.000 | 0.024 | 0.728 | 0.248 | ||
| 1 spectrum, TLETNTHVK | 0.000 | 0.000 | 0.000 | 0.000 | 0.010 | 0.000 | 0.827 | 0.164 | ||
| 2 spectra, QQLGTSVELEMAK | 0.064 | 0.000 | 0.078 | 0.000 | 0.000 | 0.176 | 0.617 | 0.065 | ||
| 1 spectrum, ENDACLVEVNLNNIK | 0.000 | 0.000 | 0.000 | 0.021 | 0.089 | 0.000 | 0.599 | 0.291 | ||
| 1 spectrum, LLSYLEK | 0.000 | 0.000 | 0.000 | 0.000 | 0.000 | 0.221 | 0.573 | 0.206 | ||
| 2 spectra, AANAITK | 0.000 | 0.000 | 0.000 | 0.000 | 0.000 | 0.157 | 0.706 | 0.138 | ||
| 1 spectrum, NNDLVR | 0.161 | 0.000 | 0.168 | 0.076 | 0.000 | 0.183 | 0.412 | 0.000 |
| Plot | Mito | Lyso or Perox | ER | Golgi | PM | Cytosol | Nucleus | ||||||
| Expt B |
1 peptide |
2 spectra |
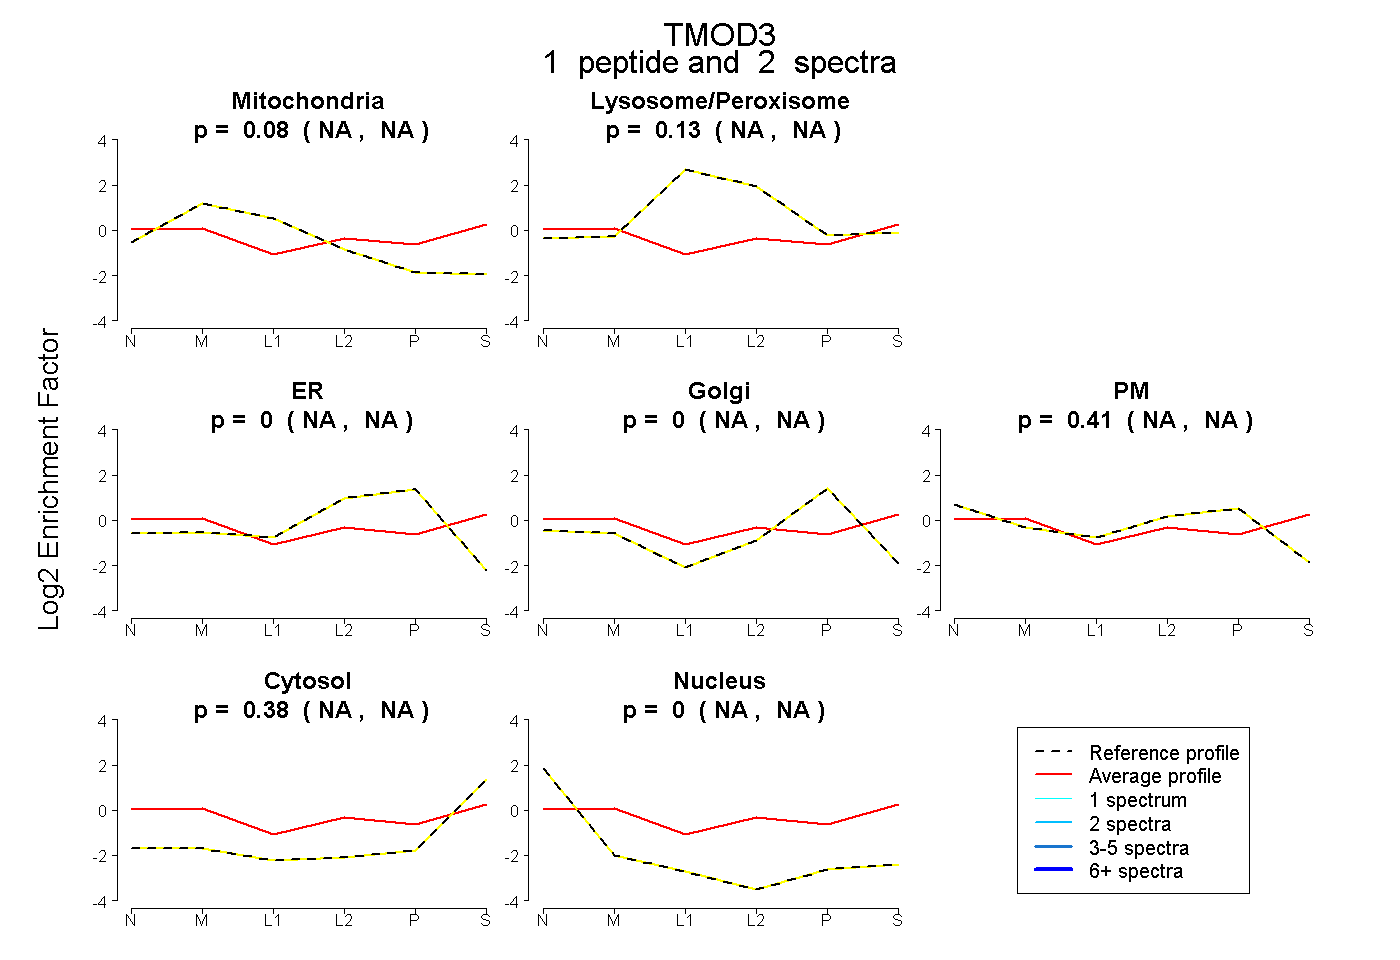 |
0.075 NA | NA |
0.133 NA | NA |
0.000 NA | NA |
0.000 NA | NA |
0.411 NA | NA |
0.380 NA | NA |
0.000 NA | NA |
|||
| Plot | Lyso | Other | |||||||||||
| Expt C |
8 peptides |
15 spectra |
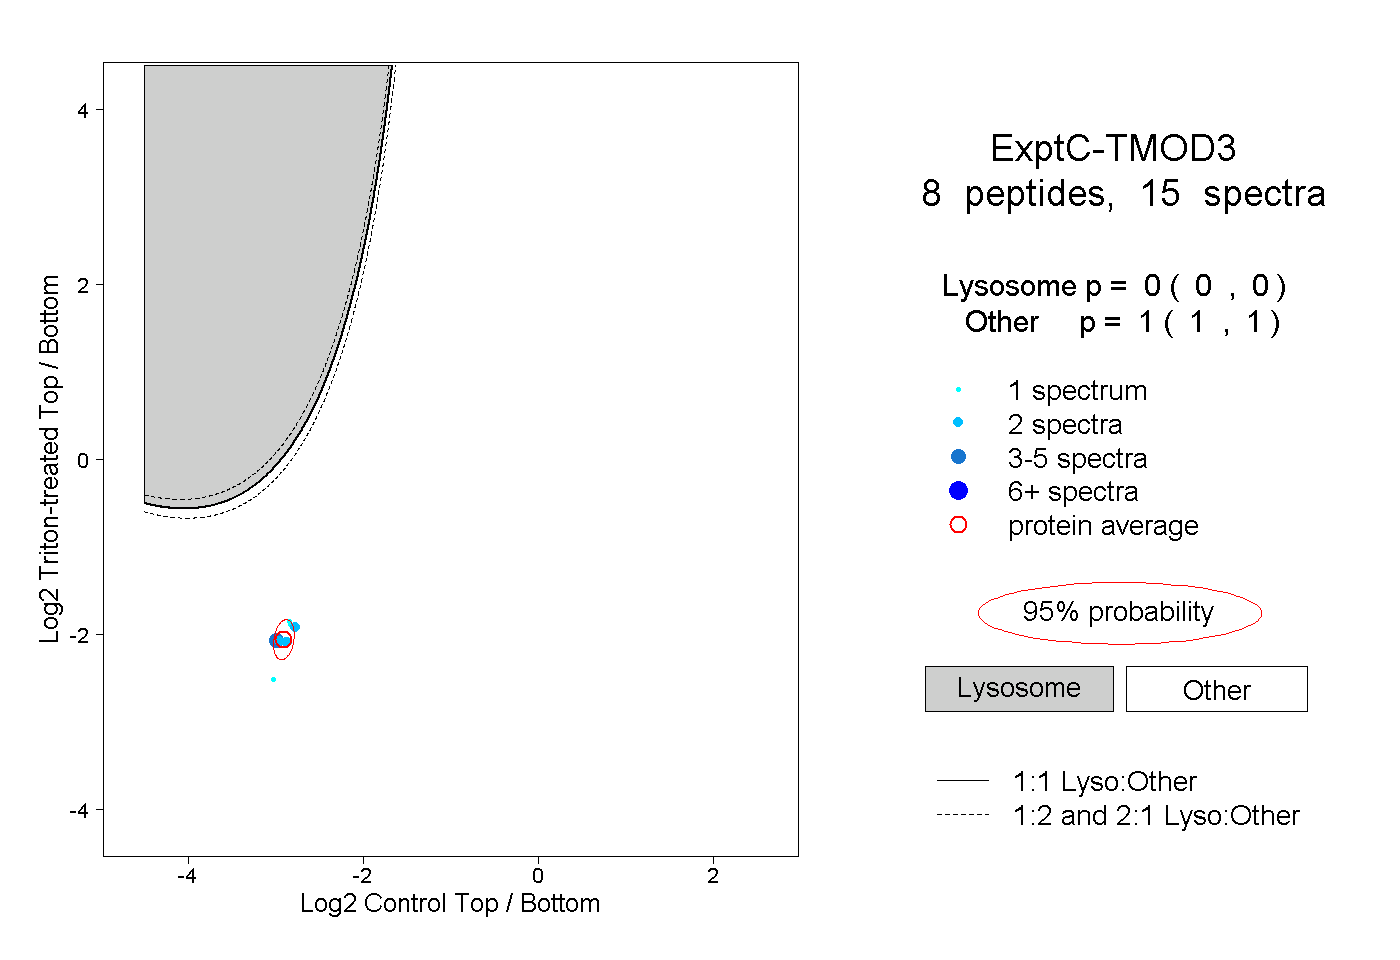 |
0.000 0.000 | 0.000 |
1.000 1.000 | 1.000 |