 13
13peptides
spectra
0.000 | 0.000
0.000 | 0.000
0.044 | 0.073
0.055 | 0.114
0.143 | 0.198
0.000 | 0.000
0.667 | 0.691
0.000 | 0.000
12peptides
spectra
0.000 | 0.000
1.000 | 1.000
| Plot | Mito | Lyso | Perox | ER | Golgi | PM | Cytosol | Nucleus | |||||
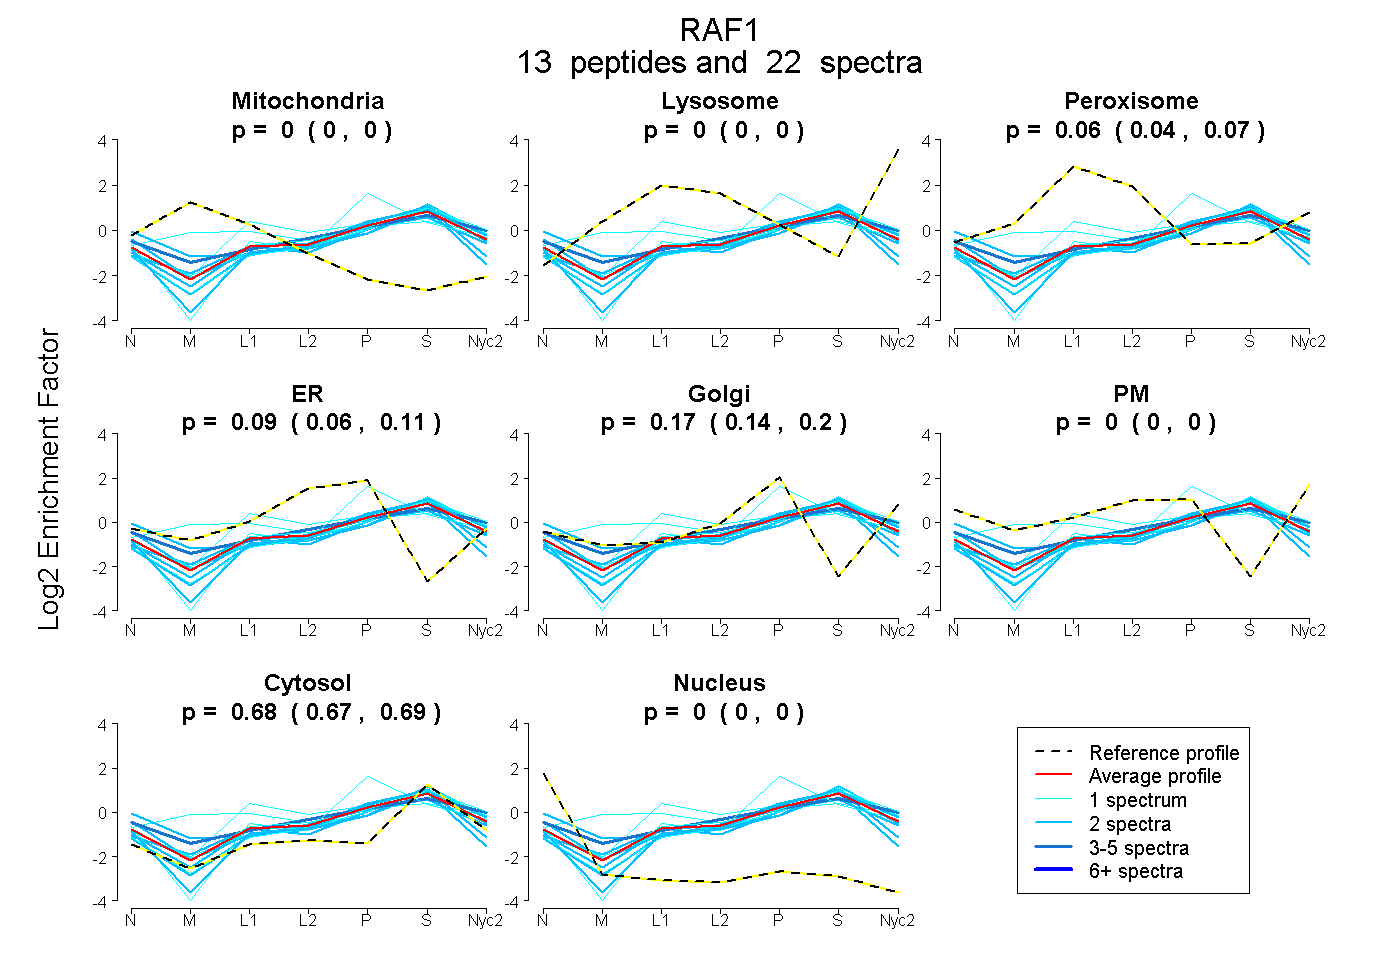
| Expt A |
13 peptides |
22 spectra |
|
0.000 0.000 | 0.000 |
0.000 0.000 | 0.000 |
0.059 0.044 | 0.073 |
0.088 0.055 | 0.114 |
0.172 0.143 | 0.198 |
0.000 0.000 | 0.000 |
0.680 0.667 | 0.691 |
0.000 0.000 | 0.000 |
||
| Plot | Lyso | Other | |||||||||||
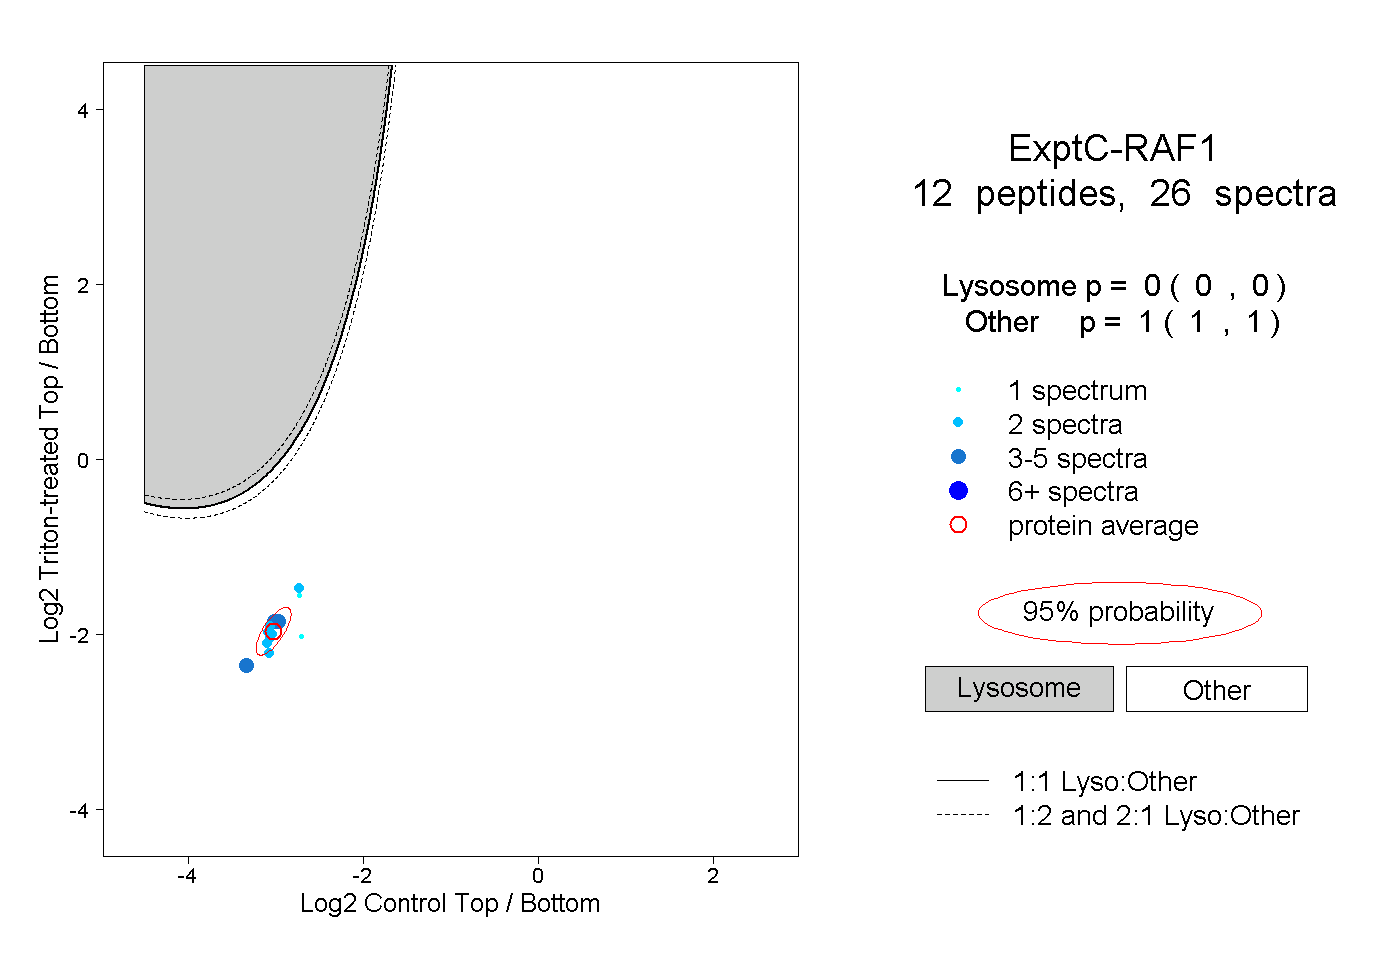
| Expt C |
12 peptides |
26 spectra |
|
0.000 0.000 | 0.000 |
1.000 1.000 | 1.000 |
| 2 spectra, NEVAVLR | 0.000 | 1.000 | ||||||||
| 2 spectra, QTAQGMDYLHAK | 0.000 | 1.000 | ||||||||
| 2 spectra, AAHTEDINACTLTTSPR | 0.000 | 1.000 | ||||||||
| 1 spectrum, TPVPAQR | 0.000 | 1.000 | ||||||||
| 2 spectra, IGSGSFGTVYK | 0.000 | 1.000 | ||||||||
| 2 spectra, GYASPDLSR | 0.000 | 1.000 | ||||||||
| 2 spectra, WHGDVAVK | 0.000 | 1.000 | ||||||||
| 2 spectra, FLLNGFR | 0.000 | 1.000 | ||||||||
| 3 spectra, CQTCGYK | 0.000 | 1.000 | ||||||||
| 3 spectra, DQIIFMVGR | 0.000 | 1.000 | ||||||||
| 1 spectrum, LVADCVK | 0.000 | 1.000 | ||||||||
| 4 spectra, APGSGTQEK | 0.000 | 1.000 |