 13
13peptides
spectra
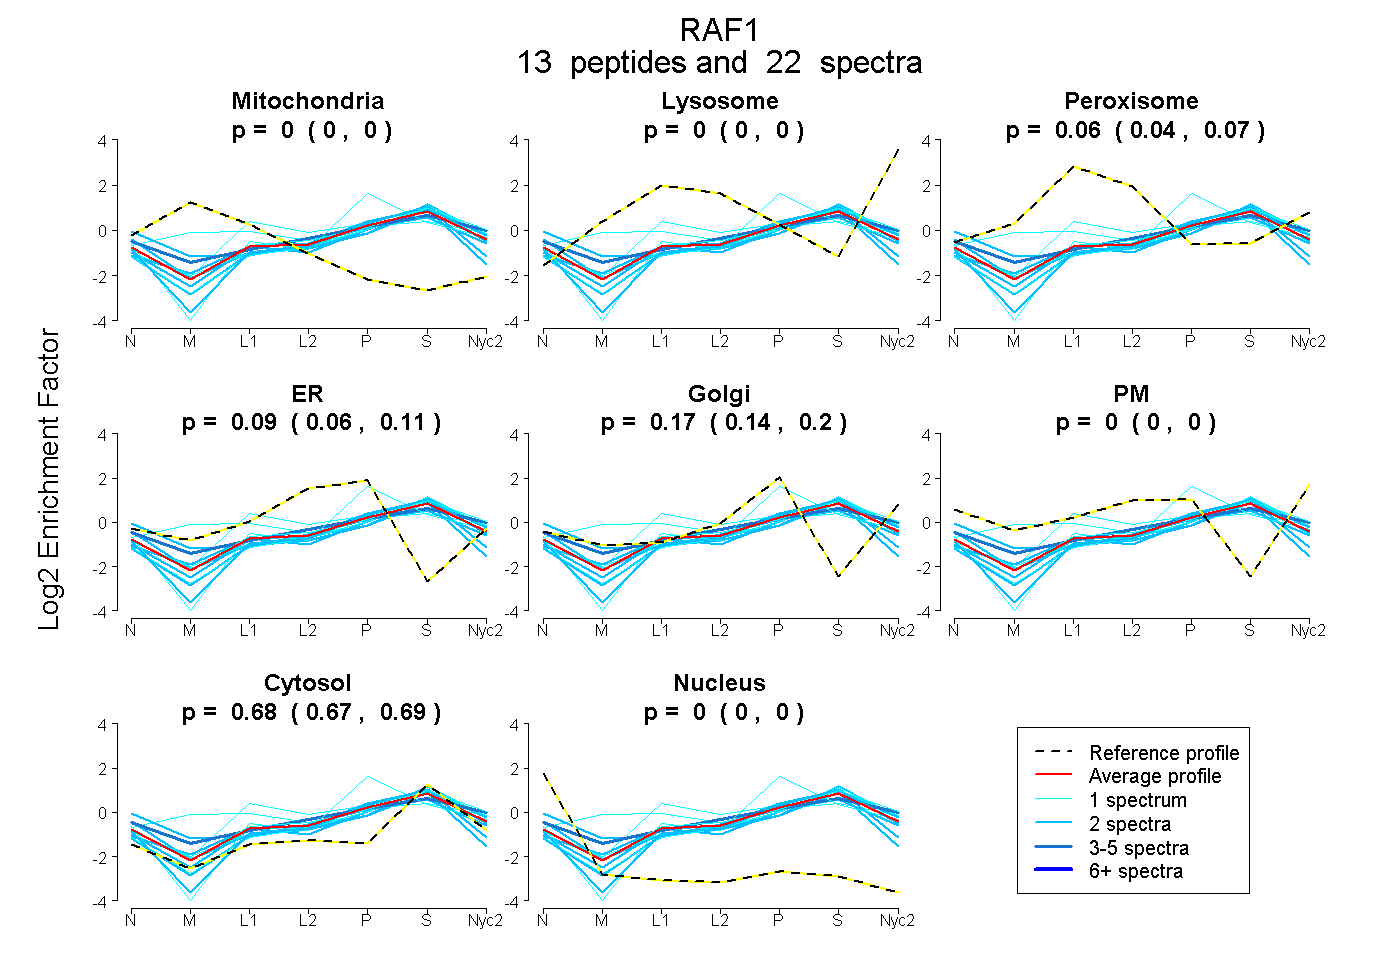
0.000 | 0.000
0.000 | 0.000
0.044 | 0.073
0.055 | 0.114
0.143 | 0.198
0.000 | 0.000
0.667 | 0.691
0.000 | 0.000
| Plot | Mito | Lyso | Perox | ER | Golgi | PM | Cytosol | Nucleus | |||||
| Expt A |
13 peptides |
22 spectra |
|
0.000 0.000 | 0.000 |
0.000 0.000 | 0.000 |
0.059 0.044 | 0.073 |
0.088 0.055 | 0.114 |
0.172 0.143 | 0.198 |
0.000 0.000 | 0.000 |
0.680 0.667 | 0.691 |
0.000 0.000 | 0.000 |
| 4 spectra, QTAQGMDYLHAK | 0.000 | 0.000 | 0.091 | 0.000 | 0.166 | 0.158 | 0.586 | 0.000 | ||
| 1 spectrum, AAHTEDINACTLTTSPR | 0.080 | 0.006 | 0.286 | 0.000 | 0.227 | 0.000 | 0.401 | 0.000 | ||
| 2 spectra, HLHVQETK | 0.016 | 0.000 | 0.000 | 0.128 | 0.040 | 0.188 | 0.622 | 0.006 | ||
| 2 spectra, TPVPAQR | 0.000 | 0.000 | 0.000 | 0.062 | 0.148 | 0.000 | 0.790 | 0.000 | ||
| 1 spectrum, IGSGSFGTVYK | 0.000 | 0.045 | 0.038 | 0.000 | 0.214 | 0.000 | 0.704 | 0.000 | ||
| 2 spectra, GYASPDLSR | 0.000 | 0.040 | 0.000 | 0.100 | 0.155 | 0.000 | 0.704 | 0.000 | ||
| 1 spectrum, VVDPTPEQLQAFR | 0.000 | 0.063 | 0.076 | 0.000 | 0.197 | 0.000 | 0.664 | 0.000 | ||
| 1 spectrum, SNNIFLHEGLTVK | 0.000 | 0.000 | 0.000 | 0.000 | 0.430 | 0.000 | 0.570 | 0.000 | ||
| 2 spectra, GLQPECCAVFR | 0.000 | 0.000 | 0.013 | 0.207 | 0.000 | 0.000 | 0.781 | 0.000 | ||
| 2 spectra, CQTCGYK | 0.000 | 0.000 | 0.000 | 0.223 | 0.000 | 0.000 | 0.738 | 0.039 | ||
| 2 spectra, DQIIFMVGR | 0.000 | 0.031 | 0.000 | 0.000 | 0.163 | 0.000 | 0.807 | 0.000 | ||
| 1 spectrum, FQMFQLIDIAR | 0.000 | 0.000 | 0.280 | 0.067 | 0.084 | 0.000 | 0.569 | 0.000 | ||
| 1 spectrum, IGDFGLATVK | 0.000 | 0.026 | 0.000 | 0.000 | 0.195 | 0.000 | 0.778 | 0.000 |
| Plot | Lyso | Other | |||||||||||
| Expt C |
12 peptides |
26 spectra |
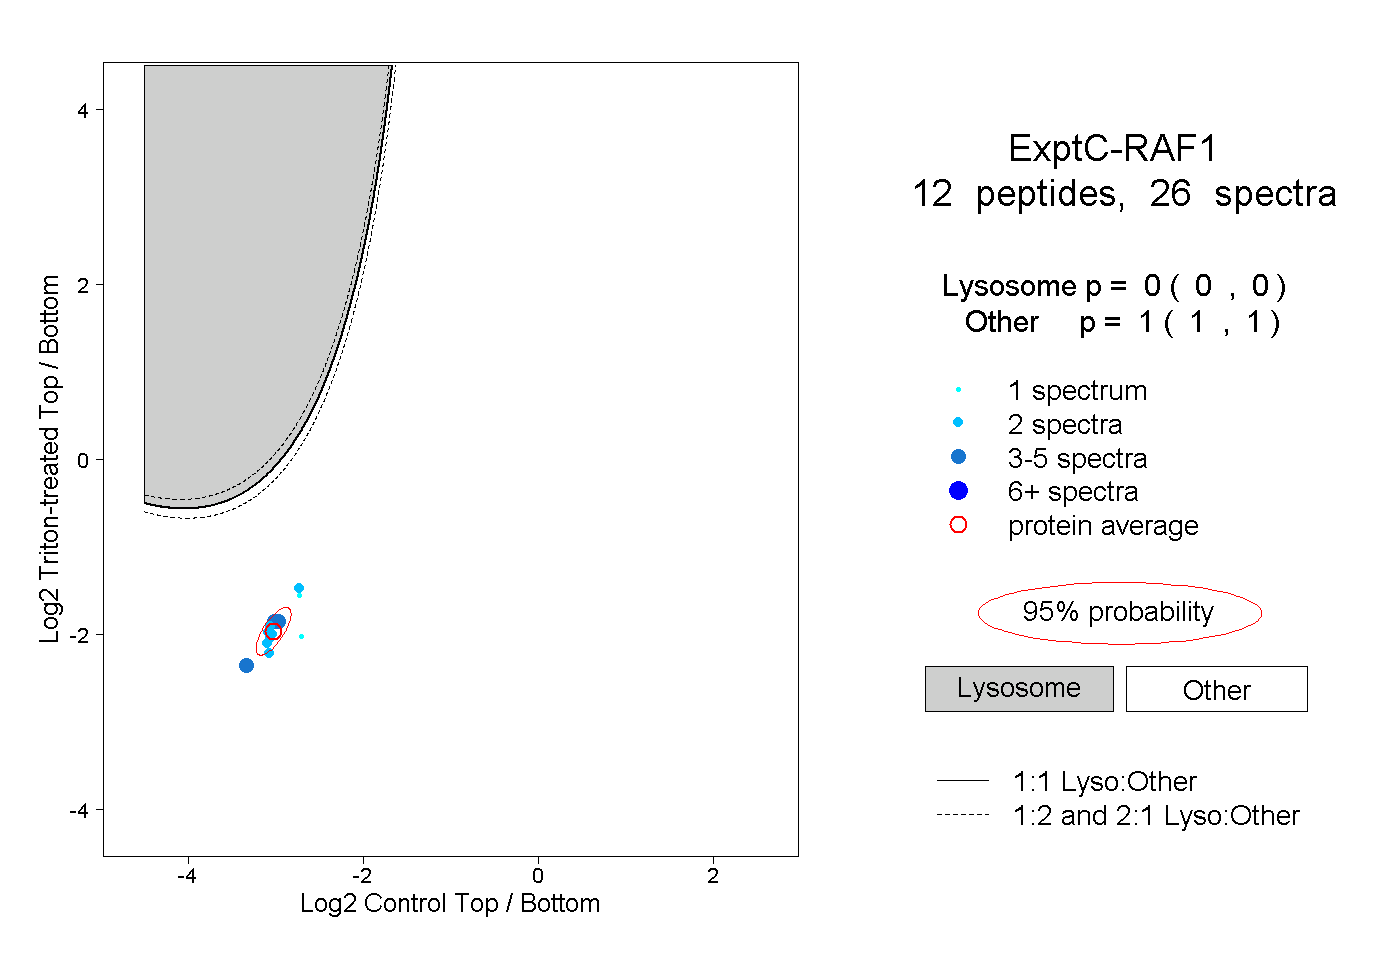 |
0.000 0.000 | 0.000 |
1.000 1.000 | 1.000 |