 2
2peptides
spectra
0.000 | 0.000
0.000 | 0.224
0.000 | 0.198
0.000 | 0.017
0.035 | 0.367
0.000 | 0.399
0.377 | 0.461
0.000 | 0.000
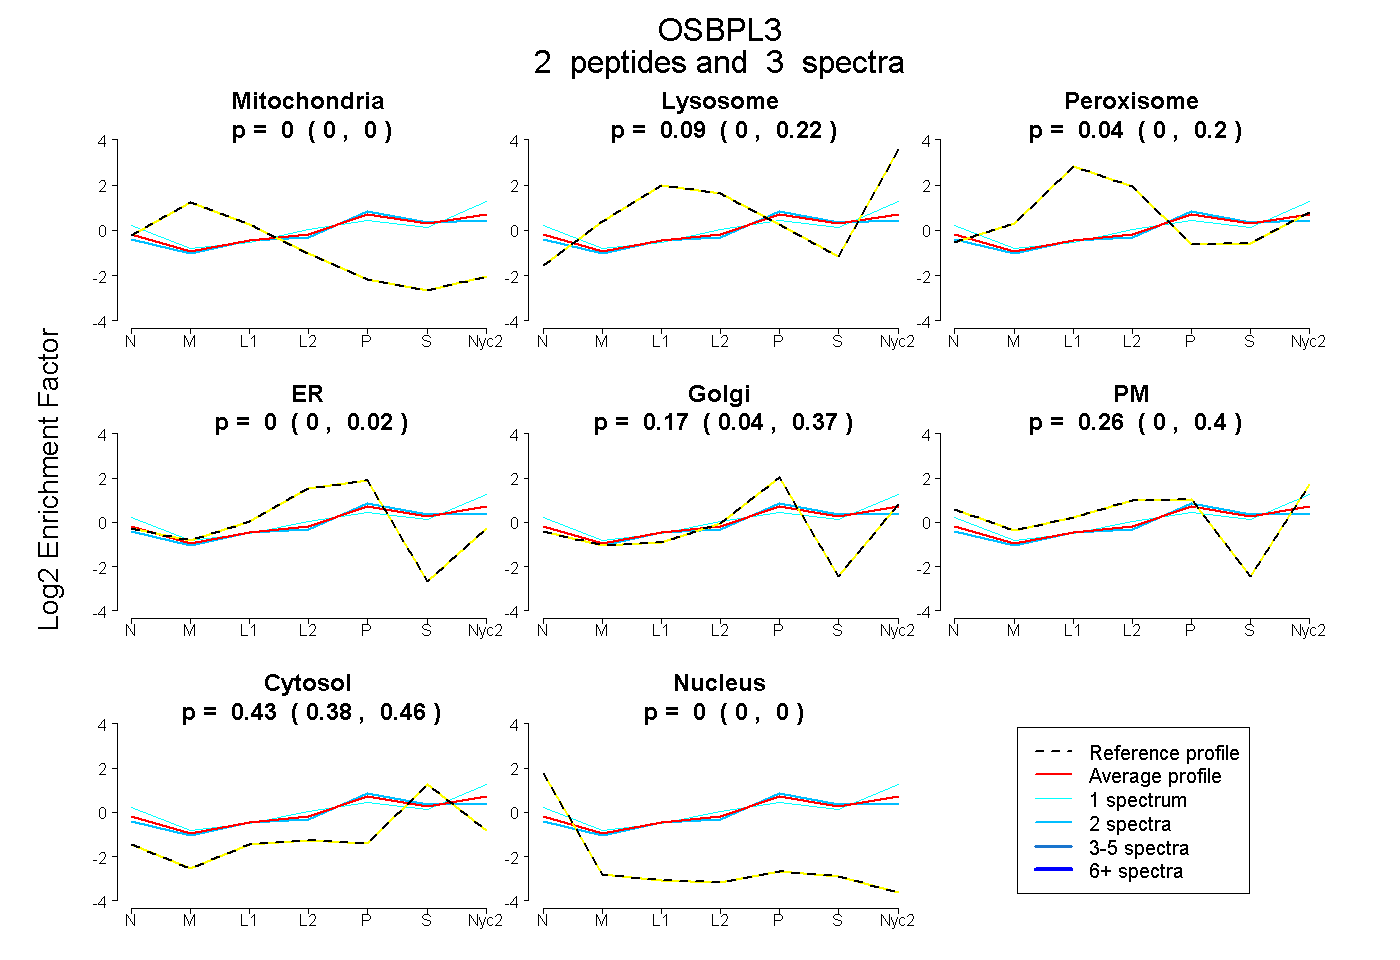
| Plot | Mito | Lyso | Perox | ER | Golgi | PM | Cytosol | Nucleus | |||||
| Expt A |
2 peptides |
3 spectra |
|
0.000 0.000 | 0.000 |
0.091 0.000 | 0.224 |
0.039 0.000 | 0.198 |
0.000 0.000 | 0.017 |
0.172 0.035 | 0.367 |
0.264 0.000 | 0.399 |
0.433 0.377 | 0.461 |
0.000 0.000 | 0.000 |