 30
30peptides
spectra
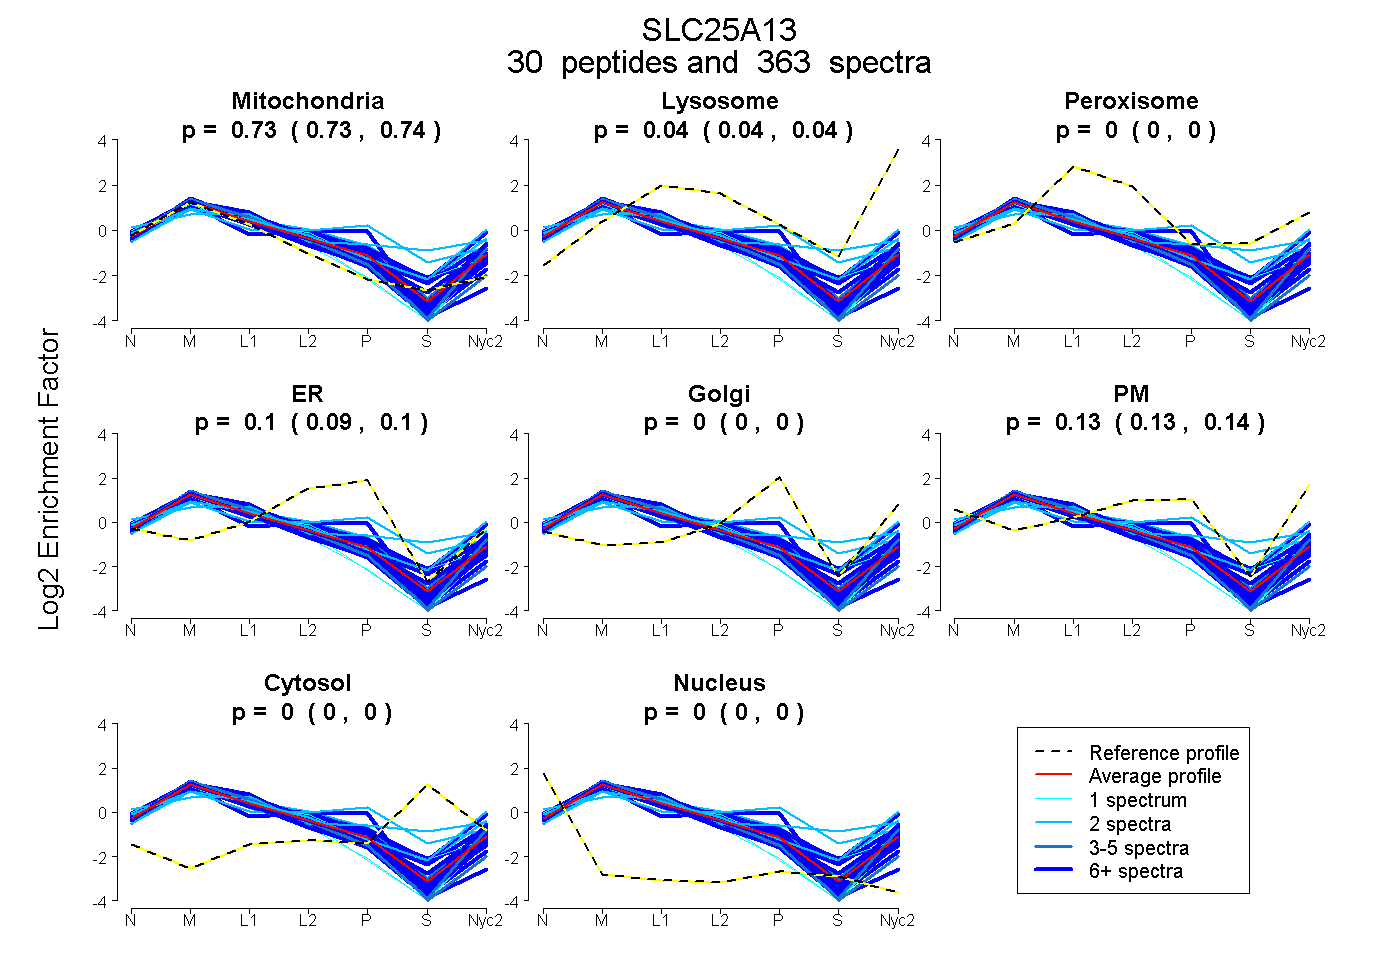
0.733 | 0.736
0.035 | 0.038
0.000 | 0.000
0.092 | 0.098
0.000 | 0.000
0.129 | 0.136
0.000 | 0.000
0.000 | 0.000
29peptides
spectra
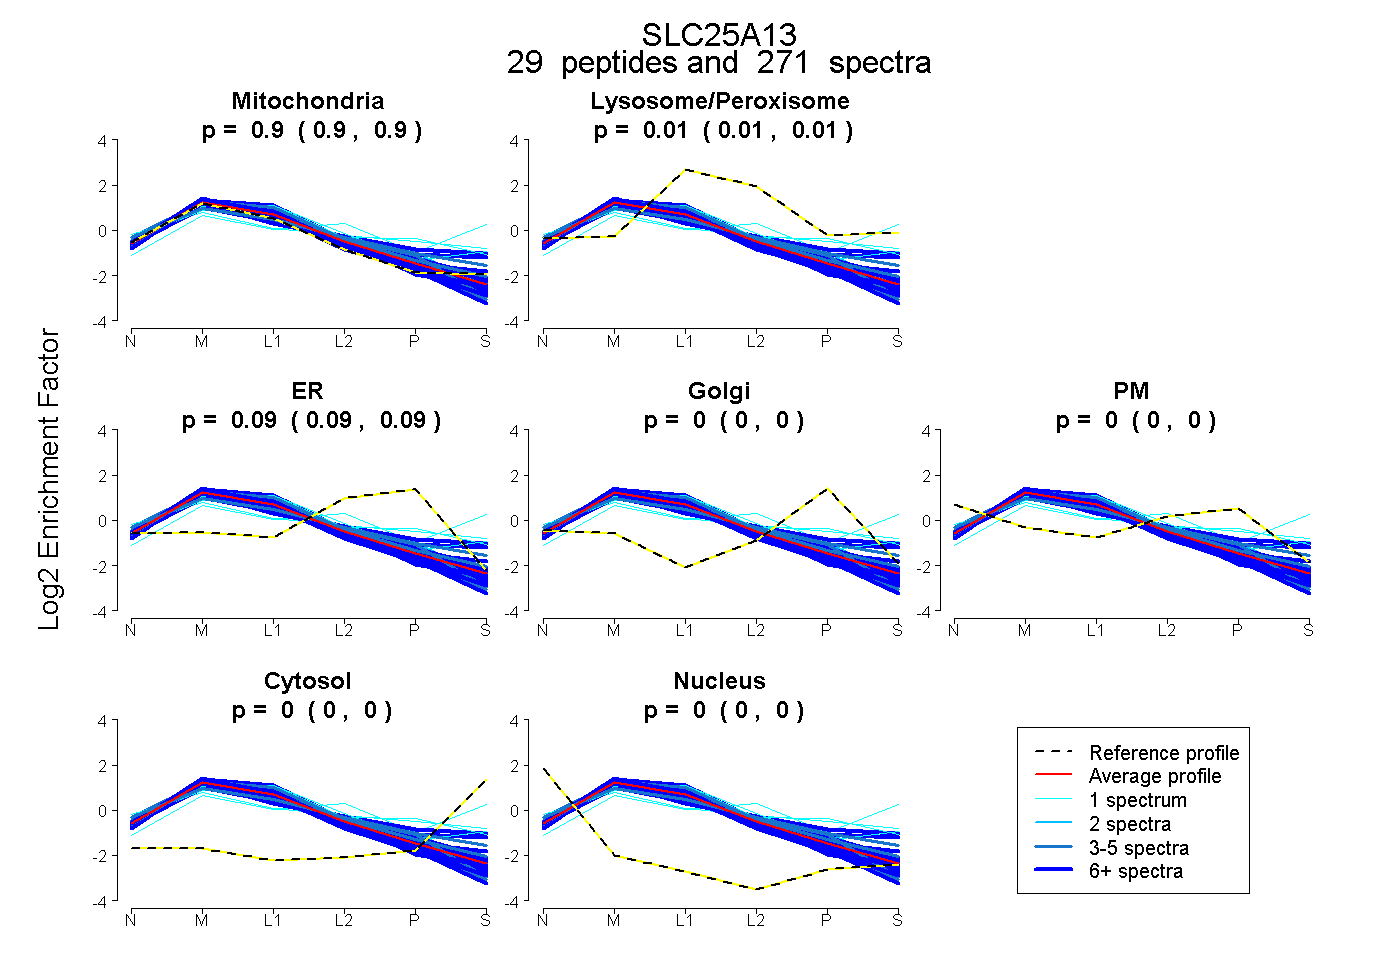
0.898 | 0.901
0.010 | 0.013
0.086 | 0.090
0.000 | 0.000
0.000 | 0.000
0.000 | 0.000
0.000 | 0.000
33peptides
spectra
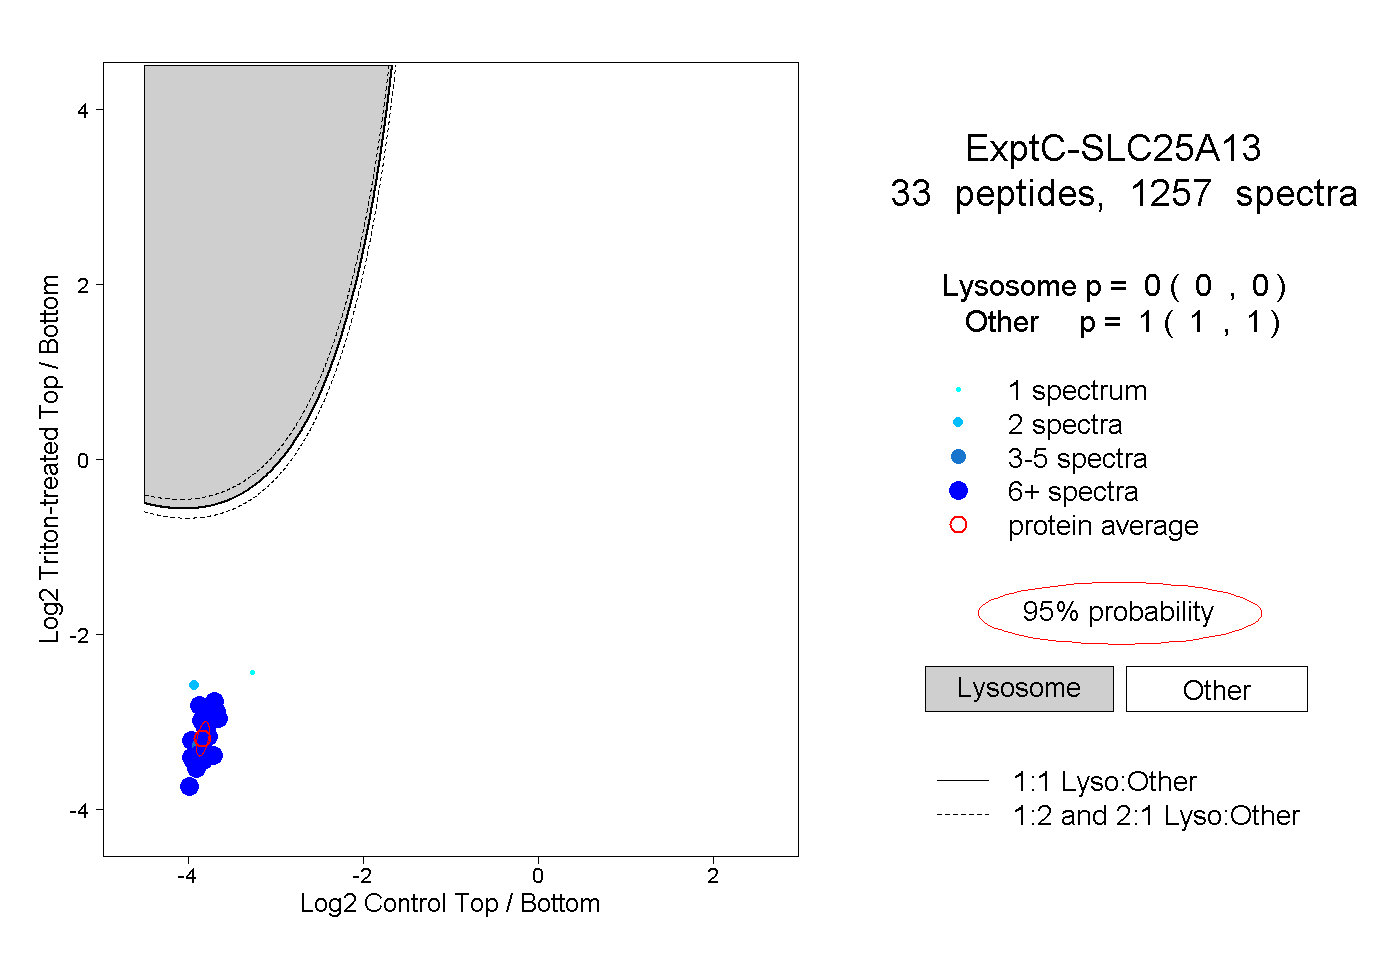
0.000 | 0.000
1.000 | 1.000
19peptides
spectra
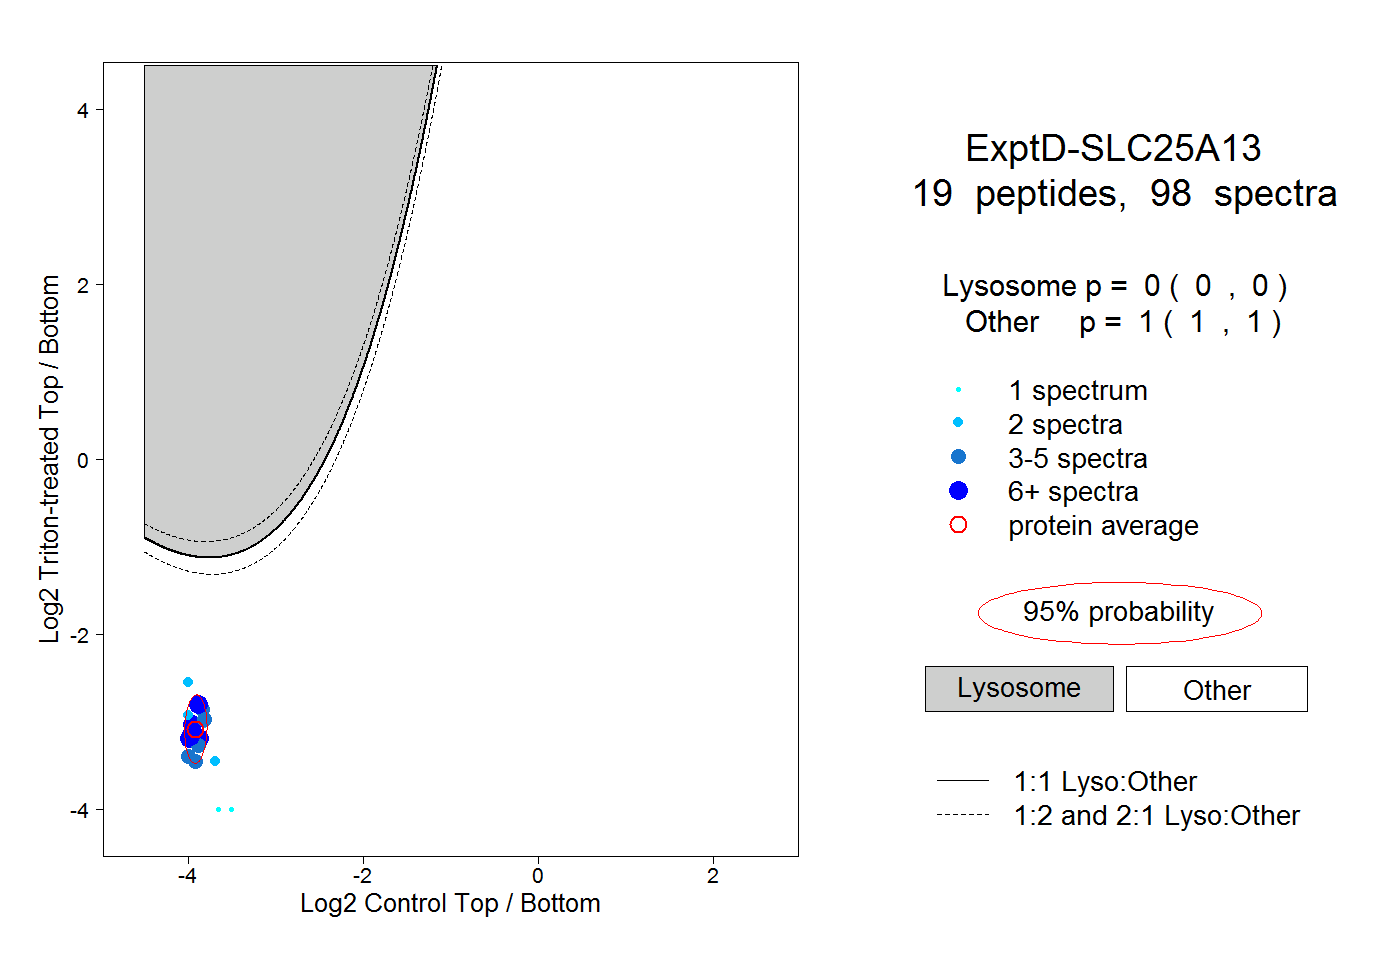
0.000 | 0.000
1.000 | 1.000