 3
3peptides
spectra
0.000 | 0.315
0.000 | 0.392
0.000 | 0.286
0.000 | 0.115
0.000 | 0.125
0.000 | 0.202
0.236 | 0.597
0.000 | 0.217
1peptide
spectra
0.000 | 0.000
1.000 | 1.000
| Plot | Mito | Lyso | Perox | ER | Golgi | PM | Cytosol | Nucleus | |||||
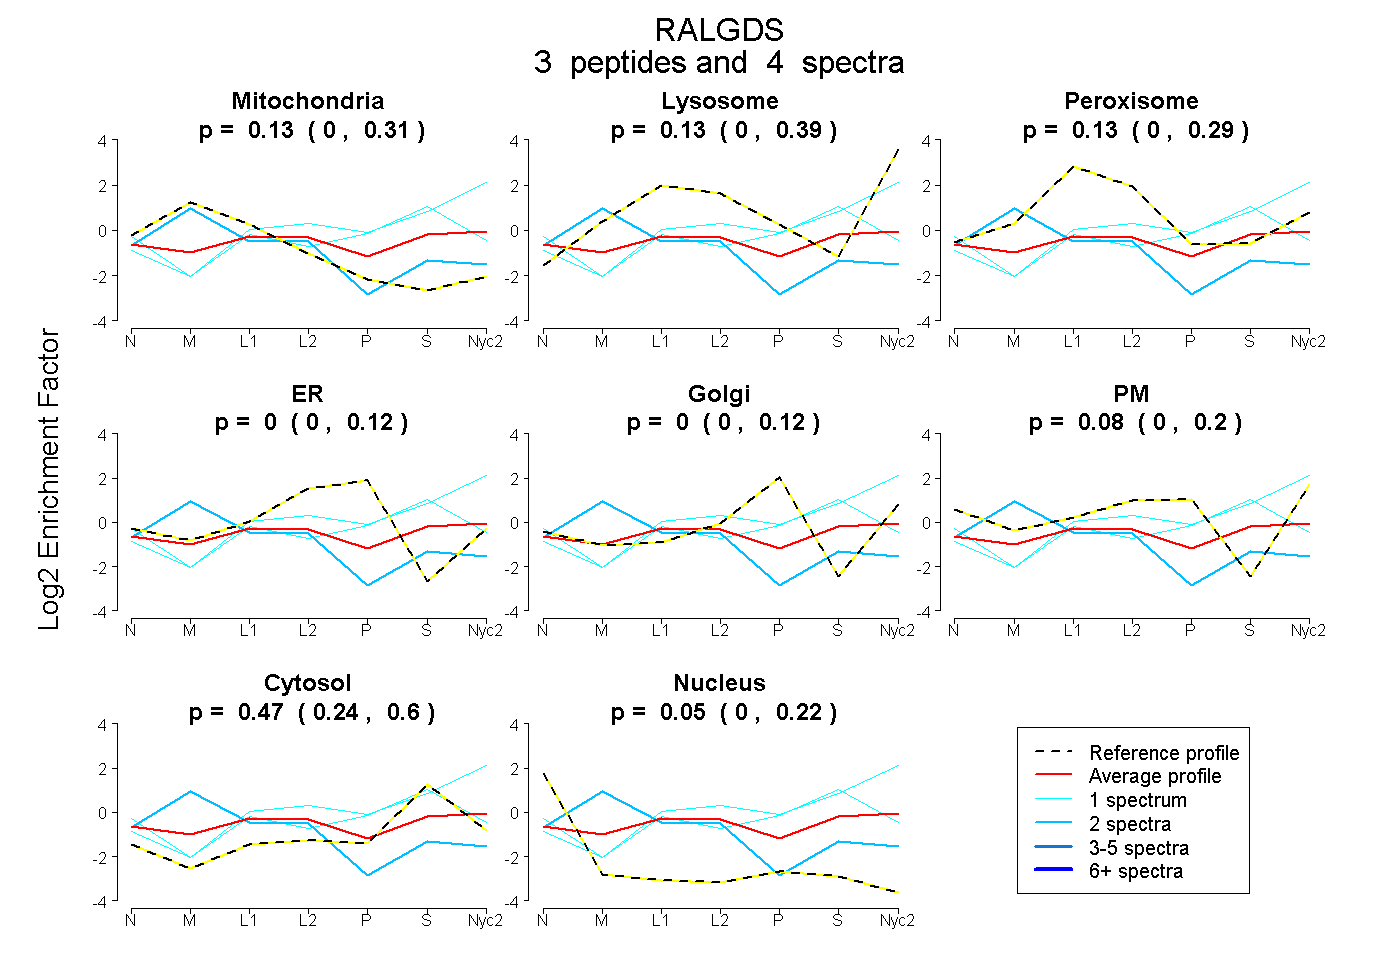
| Expt A |
3 peptides |
4 spectra |
|
0.130 0.000 | 0.315 |
0.128 0.000 | 0.392 |
0.134 0.000 | 0.286 |
0.000 0.000 | 0.115 |
0.000 0.000 | 0.125 |
0.085 0.000 | 0.202 |
0.470 0.236 | 0.597 |
0.054 0.000 | 0.217 |
||
| Plot | Lyso | Other | |||||||||||
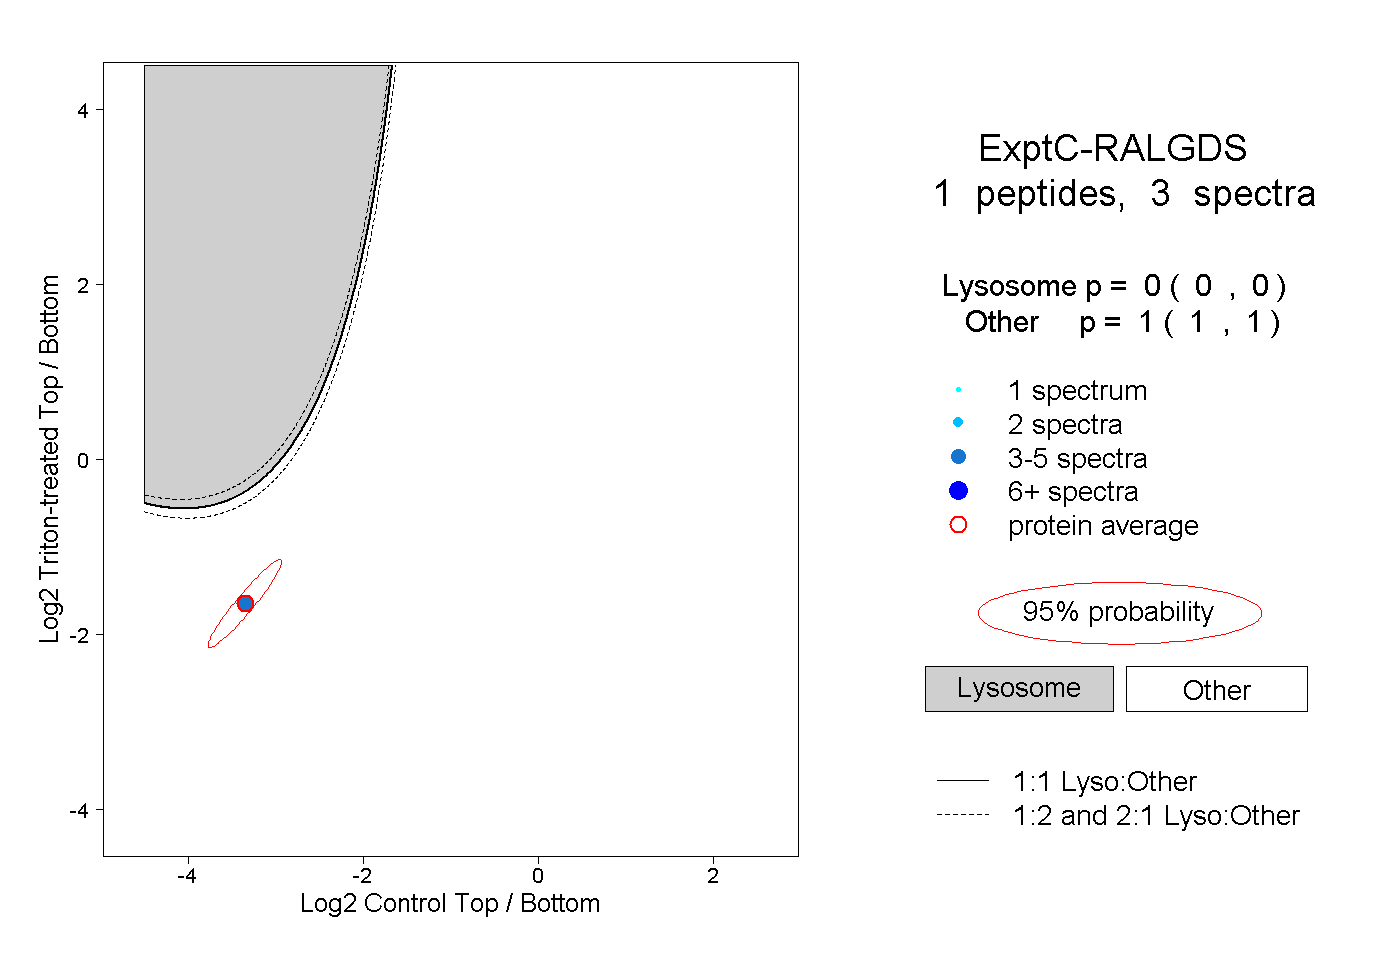
| Expt C |
1 peptide |
3 spectra |
|
0.000 0.000 | 0.000 |
1.000 1.000 | 1.000 |