 4
4peptides
spectra
0.001 | 0.016
0.000 | 0.000
0.000 | 0.000
0.000 | 0.000
0.000 | 0.000
0.002 | 0.017
0.000 | 0.000
0.977 | 0.984
| Plot | Mito | Lyso | Perox | ER | Golgi | PM | Cytosol | Nucleus | |||||
| Expt A |
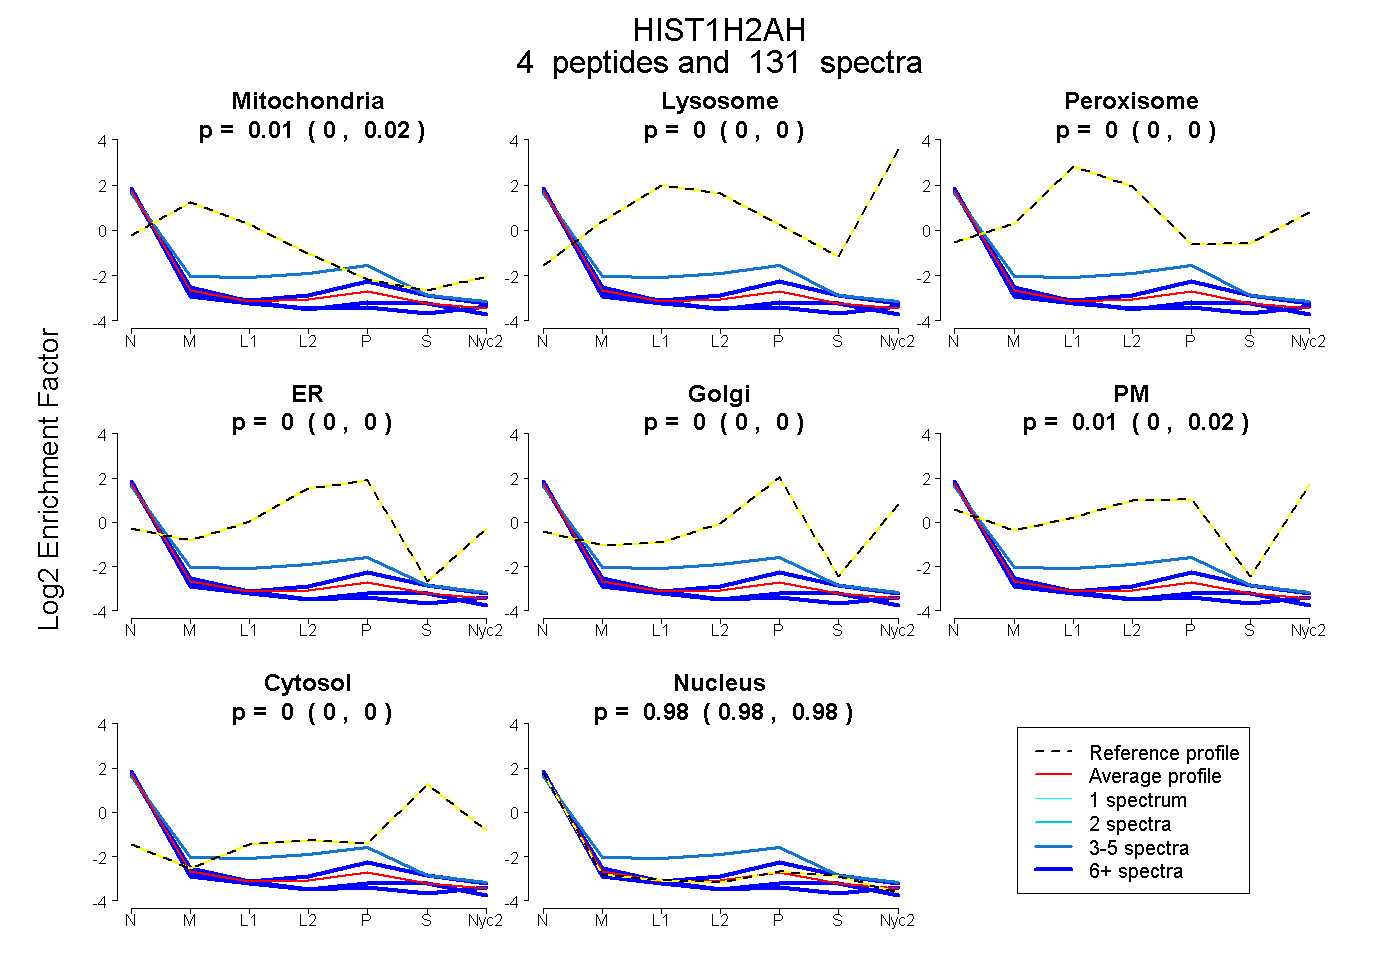
4 peptides |
131 spectra |
|
0.009 0.001 | 0.016 |
0.000 0.000 | 0.000 |
0.000 0.000 | 0.000 |
0.000 0.000 | 0.000 |
0.000 0.000 | 0.000 |
0.010 0.002 | 0.017 |
0.000 0.000 | 0.000 |
0.981 0.977 | 0.984 |
| 29 spectra, NDEELNK | 0.000 | 0.000 | 0.000 | 0.000 | 0.069 | 0.000 | 0.000 | 0.931 | ||
| 58 spectra, HLQLAIR | 0.000 | 0.000 | 0.000 | 0.000 | 0.000 | 0.000 | 0.000 | 1.000 | ||
| 40 spectra, AGLQFPVGR | 0.000 | 0.000 | 0.000 | 0.000 | 0.000 | 0.000 | 0.000 | 1.000 | ||
| 4 spectra, TESHHK | 0.059 | 0.000 | 0.000 | 0.205 | 0.000 | 0.000 | 0.000 | 0.736 |
| Plot | Mito | Lyso or Perox | ER | Golgi | PM | Cytosol | Nucleus | ||||||
| Expt B |
2 peptides |
48 spectra |
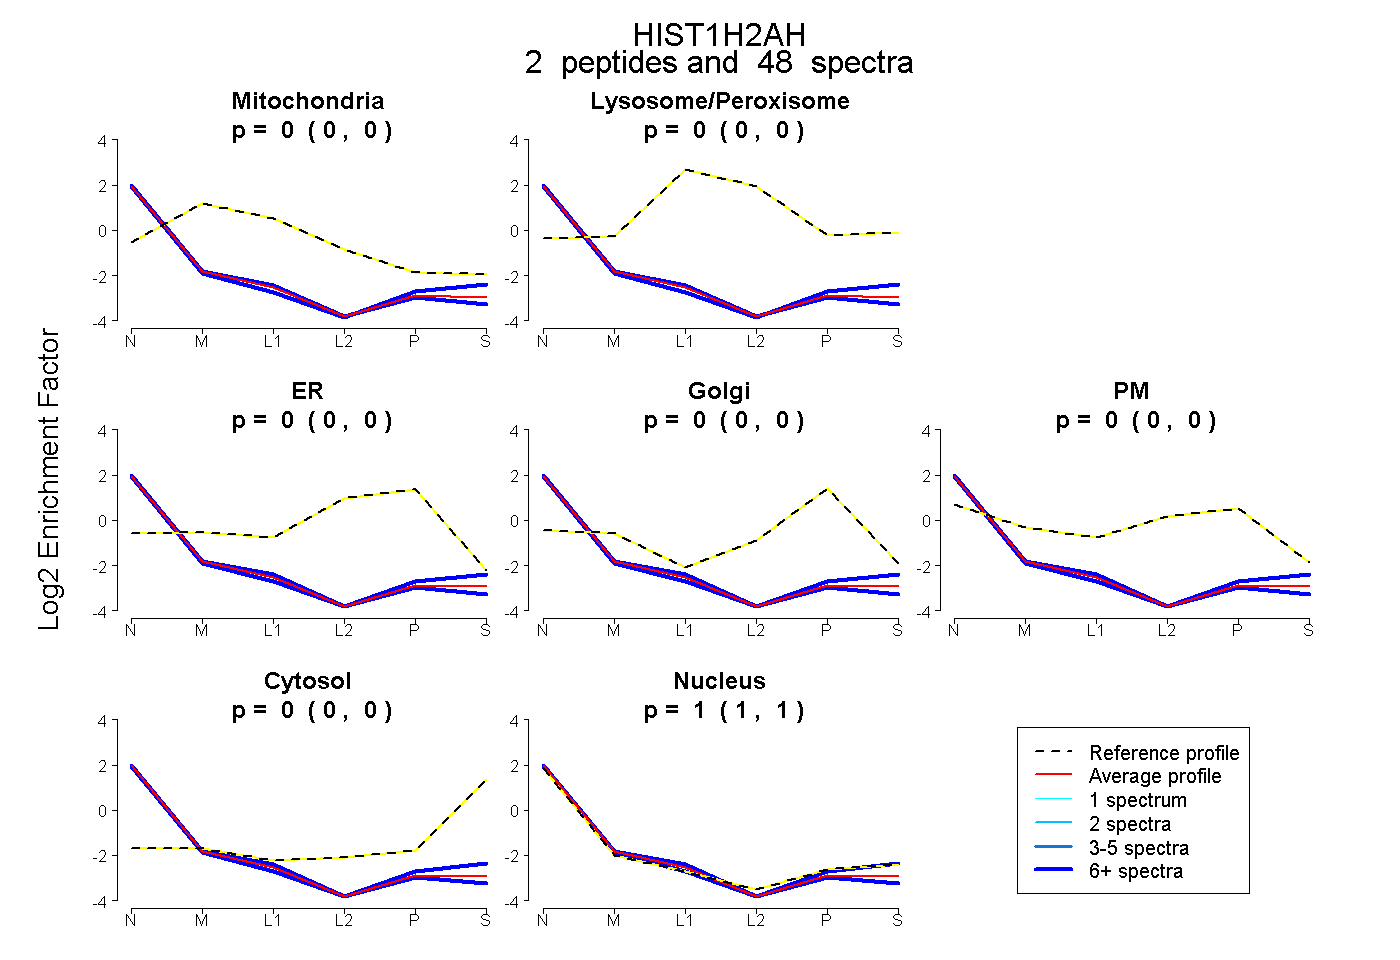 |
0.000 0.000 | 0.000 |
0.000 0.000 | 0.000 |
0.000 0.000 | 0.000 |
0.000 0.000 | 0.000 |
0.000 0.000 | 0.000 |
0.000 0.000 | 0.000 |
1.000 1.000 | 1.000 |
|||
| Plot | Lyso | Other | |||||||||||
| Expt C |
3 peptides |
16 spectra |
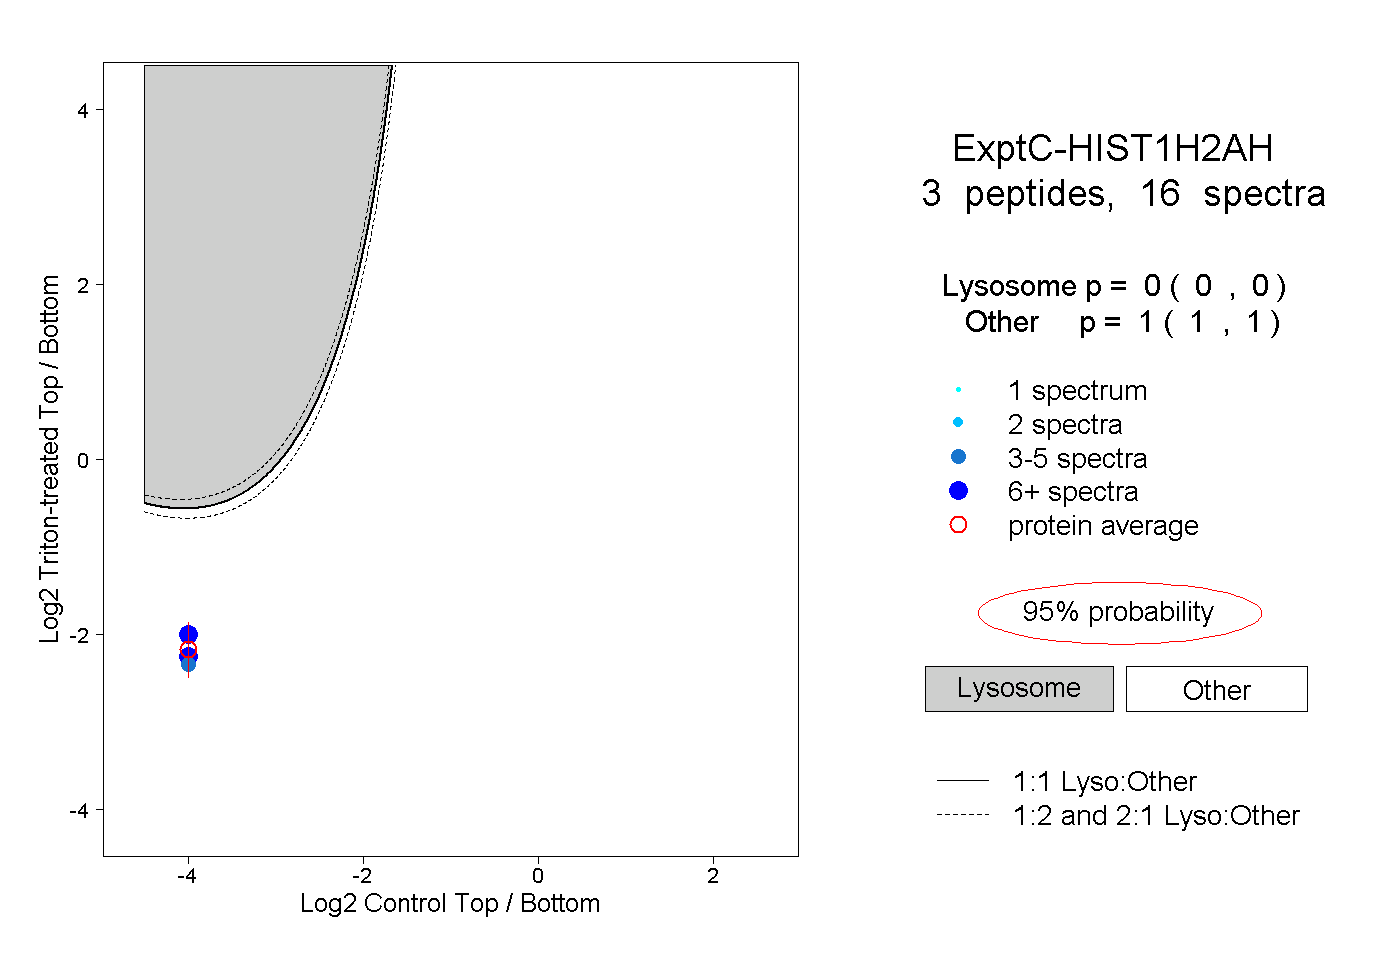 |
0.000 0.000 | 0.000 |
1.000 1.000 | 1.000 |