PGM1
[ENSRNOP00000013785]
Main page
| | | Plot |
Mito |
Lyso |
|
Perox |
ER |
Golgi |
PM |
Cytosol |
Nucleus |
|
| Expt A |
 30
30
peptides |
251
spectra |
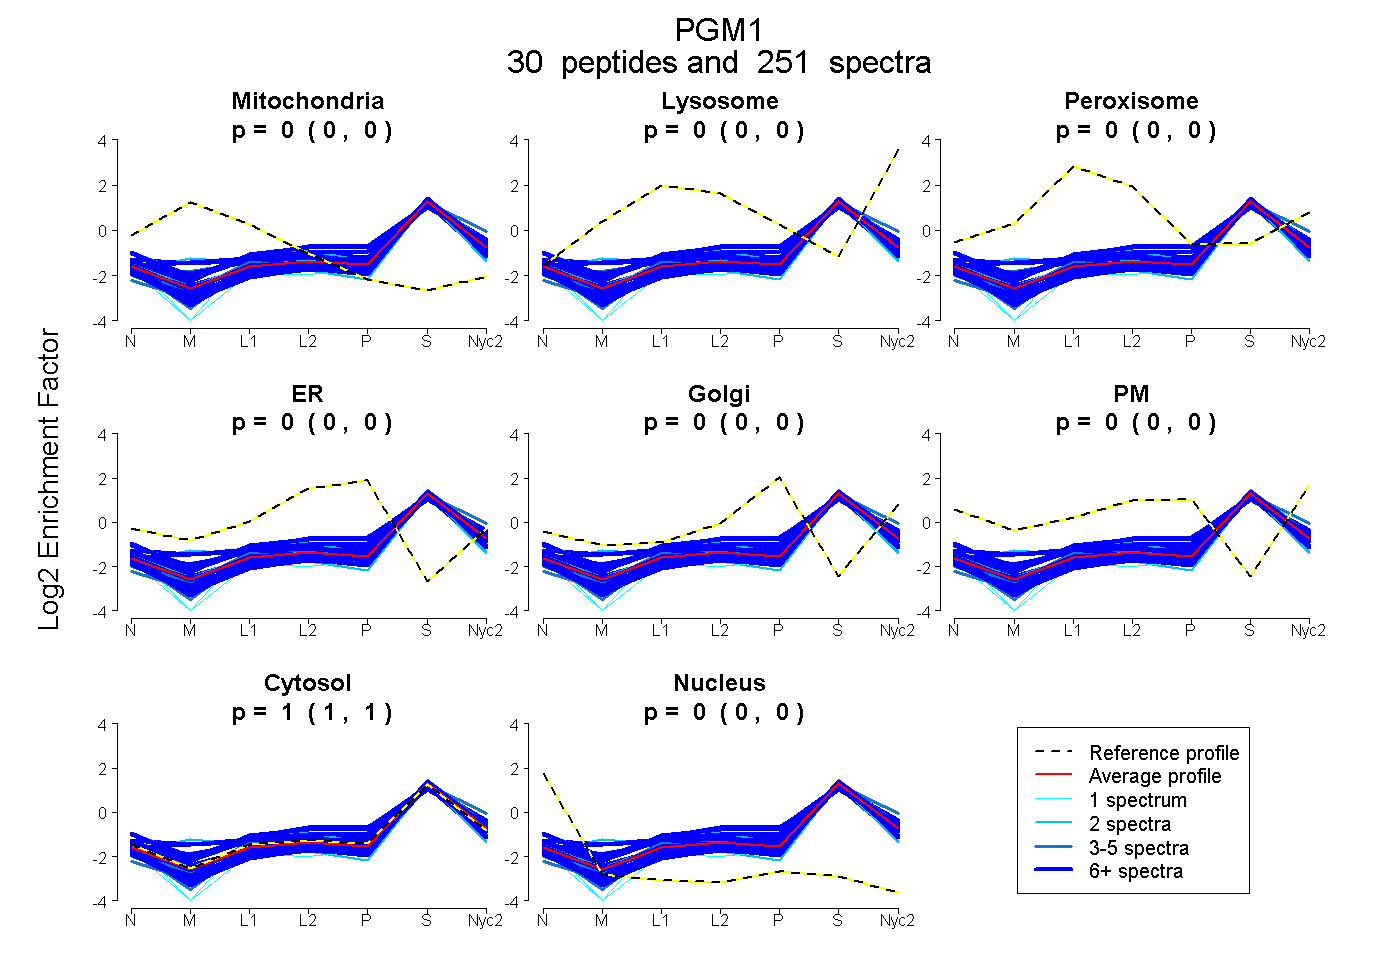 |
0.000
0.000 | 0.000 |
0.000
0.000 | 0.000 |
|
0.000
0.000 | 0.000 |
0.000
0.000 | 0.000 |
0.000
0.000 | 0.000 |
0.000
0.000 | 0.000 |
1.000
1.000 | 1.000 |
0.000
0.000 | 0.000 |
|
| | | Plot |
Mito |
|
Lyso or Perox |
|
ER |
Golgi |
PM |
Cytosol |
Nucleus |
|
| Expt B |
22
peptides |
92
spectra |
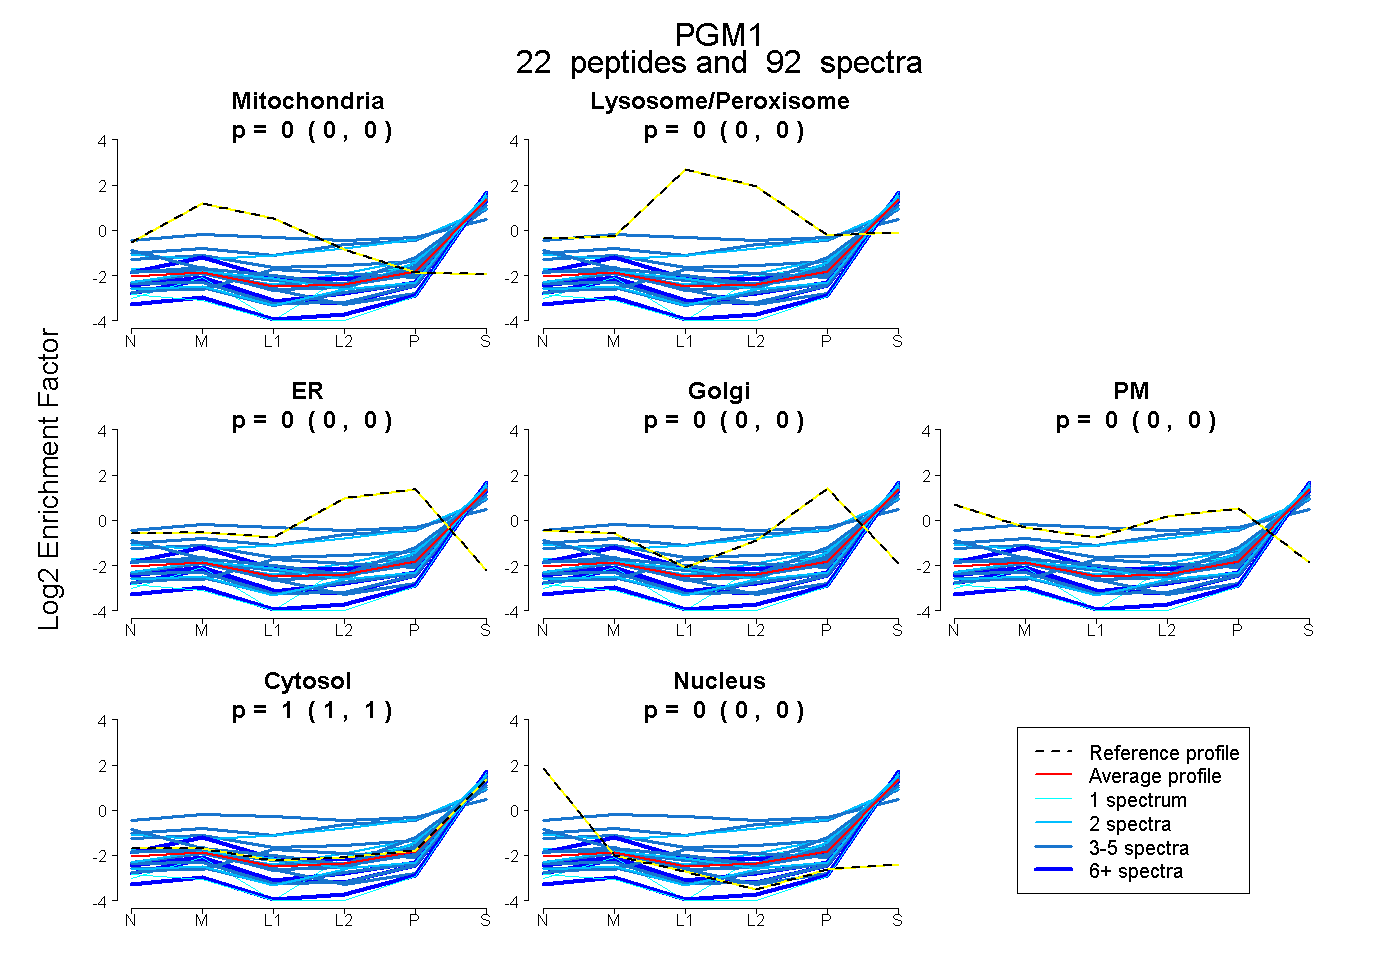 |
0.000
0.000 | 0.000 |
|
0.000
0.000 | 0.000 |
|
0.000
0.000 | 0.000 |
0.000
0.000 | 0.000 |
0.000
0.000 | 0.000 |
1.000
1.000 | 1.000 |
0.000
0.000 | 0.000 |
|
| | | Plot |
|
Lyso |
|
|
|
|
|
|
|
Other |
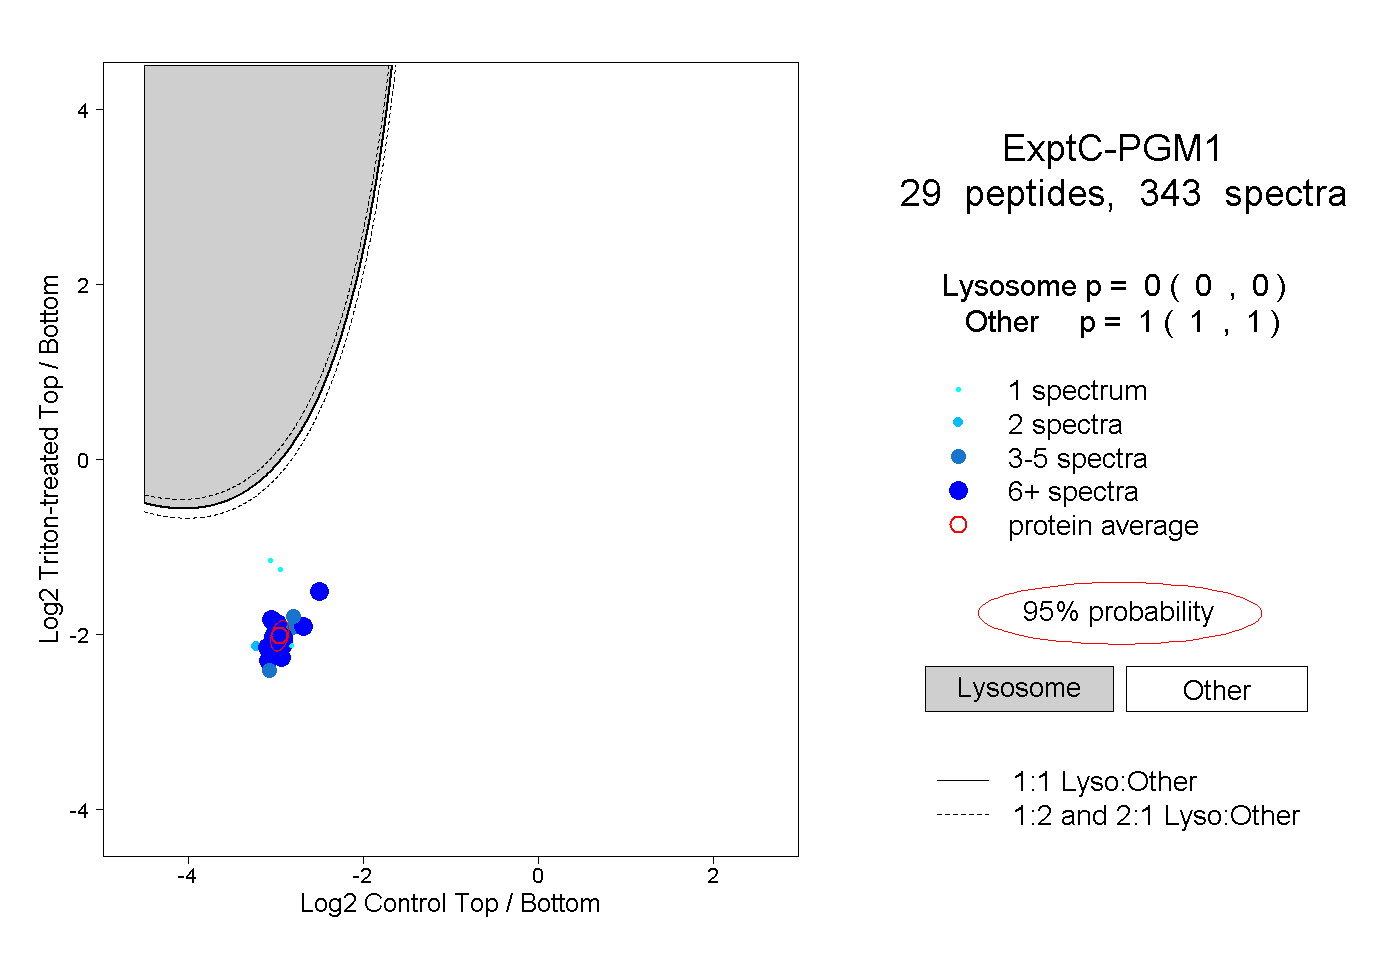
| Expt C |
29
peptides |
343
spectra |
 |
|
0.000
0.000 | 0.000 |
|
|
|
|
|
|
|
1.000
1.000 | 1.000 |
| | | Plot |
|
Lyso |
|
|
|
|
|
|
|
Other |
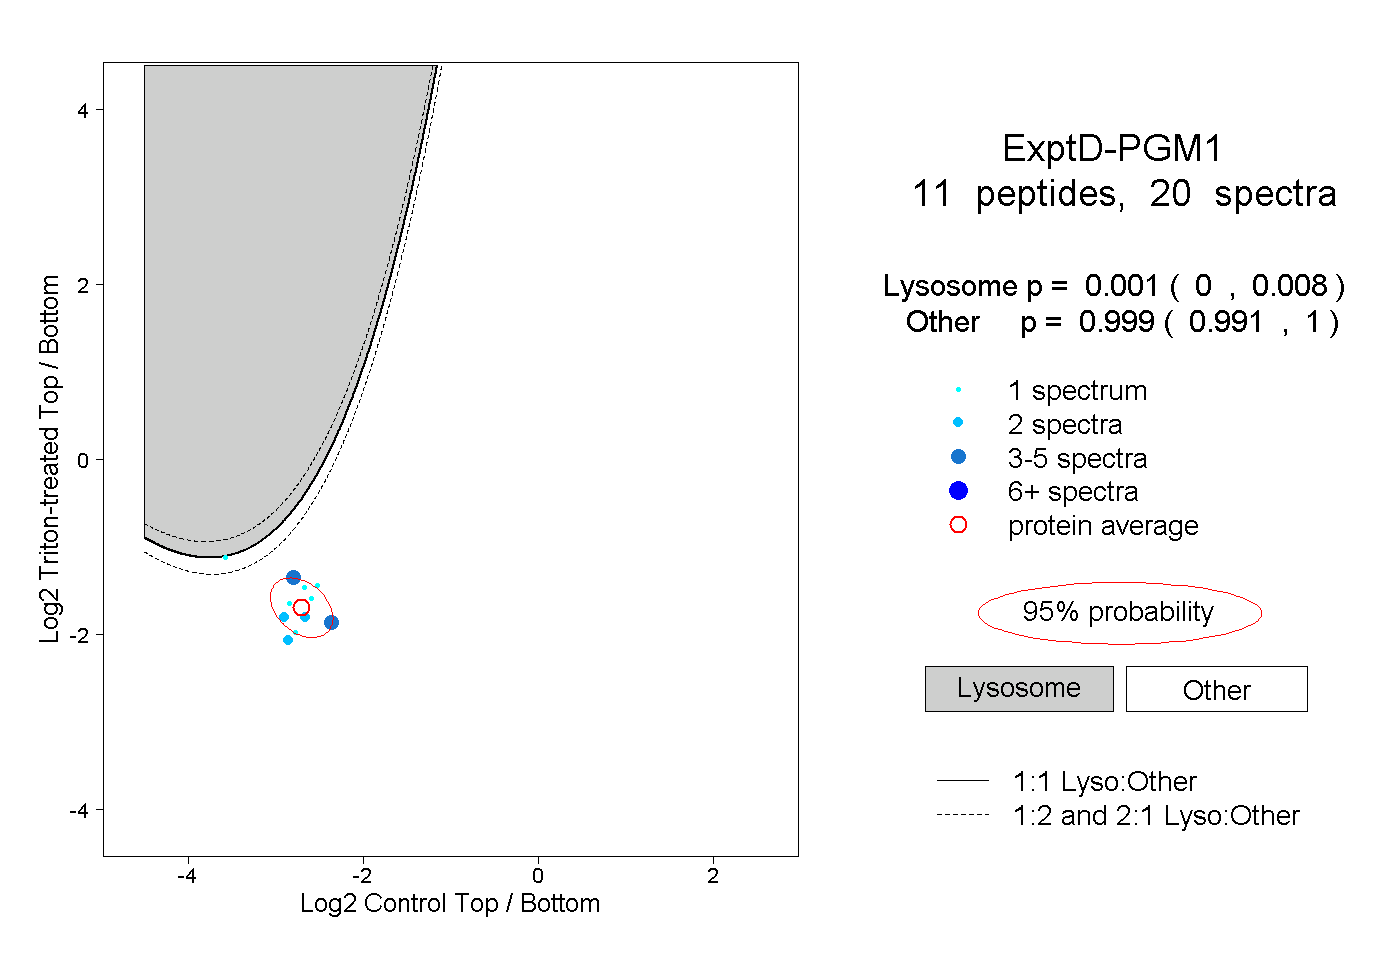
| Expt D |
11
peptides |
20
spectra |
 |
|
0.001
0.000 | 0.008 |
|
|
|
|
|
|
|
0.999
0.991 | 1.000 |
| 1 spectrum, QSVEDILK |
|
0.481 |
|
|
|
|
|
|
|
0.519 |
| 1 spectrum, QEATLVVGGDGR |
|
0.001 |
|
|
|
|
|
|
|
0.999 |
| 1 spectrum, NIFDFNALK |
|
0.000 |
|
|
|
|
|
|
|
1.000 |
| 1 spectrum, LYIDSYEK |
|
0.002 |
|
|
|
|
|
|
|
0.998 |
| 3 spectra, ELLSGPNR |
|
0.009 |
|
|
|
|
|
|
|
0.991 |
| 2 spectra, VSQLQER |
|
0.000 |
|
|
|
|
|
|
|
1.000 |
| 1 spectrum, QFSANDK |
|
0.002 |
|
|
|
|
|
|
|
0.998 |
| 1 spectrum, IFQISK |
|
0.001 |
|
|
|
|
|
|
|
0.999 |
| 2 spectra, SMPTSGALDR |
|
0.000 |
|
|
|
|
|
|
|
1.000 |
| 5 spectra, IAAANGIGR |
|
0.000 |
|
|
|
|
|
|
|
1.000 |
| 2 spectra, LIFADGSR |
|
0.001 |
|
|
|
|
|
|
|
0.999 |