19
19peptides
spectra
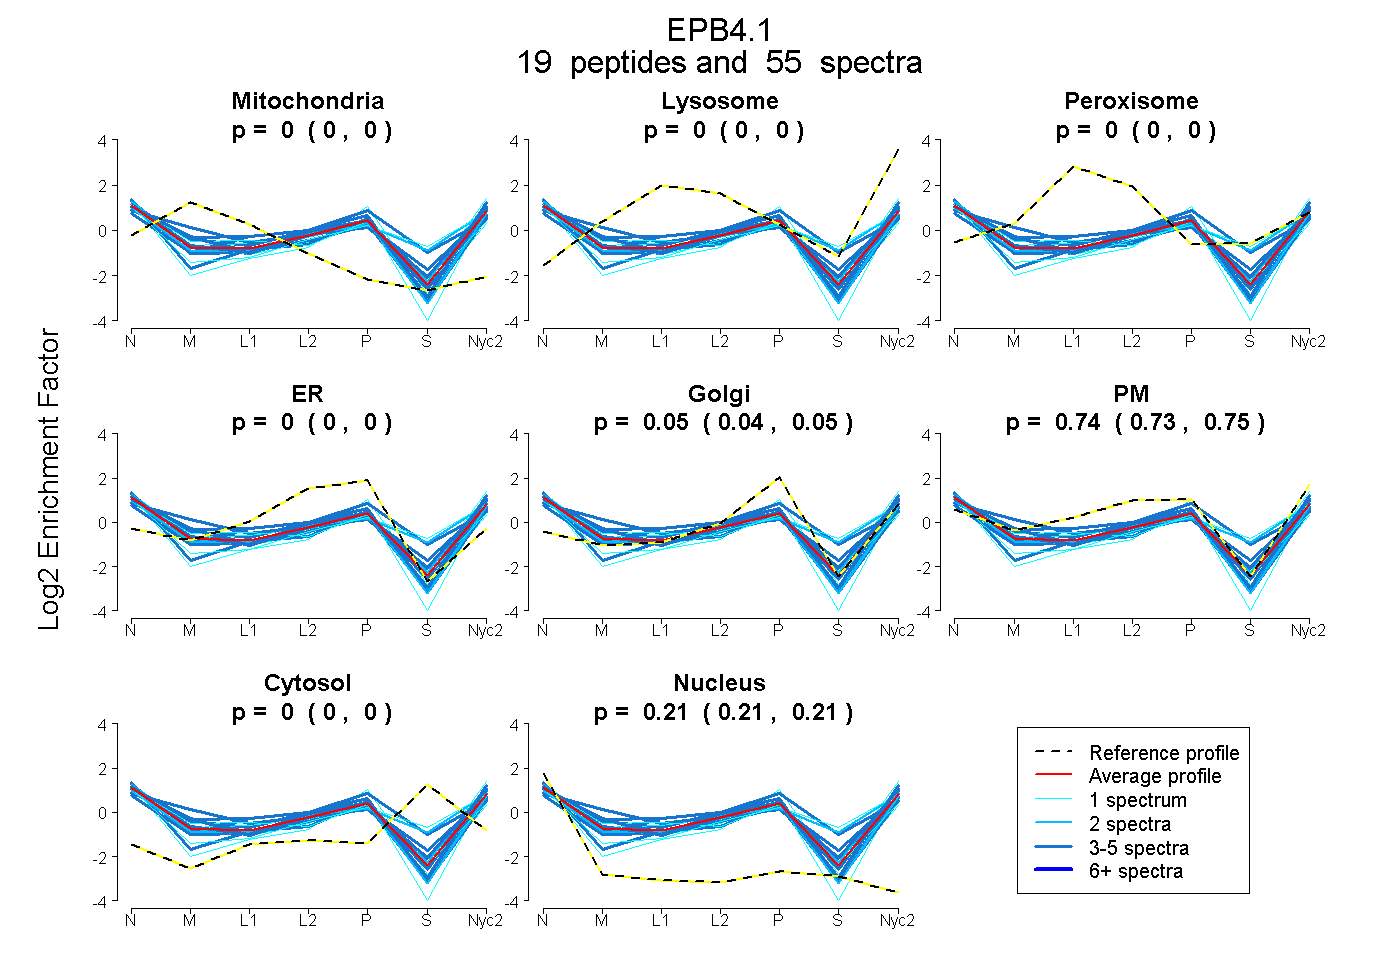
0.000 | 0.000
0.000 | 0.000
0.000 | 0.000
0.000 | 0.000
0.040 | 0.052
0.734 | 0.746
0.000 | 0.000
0.211 | 0.214
4peptides
spectra
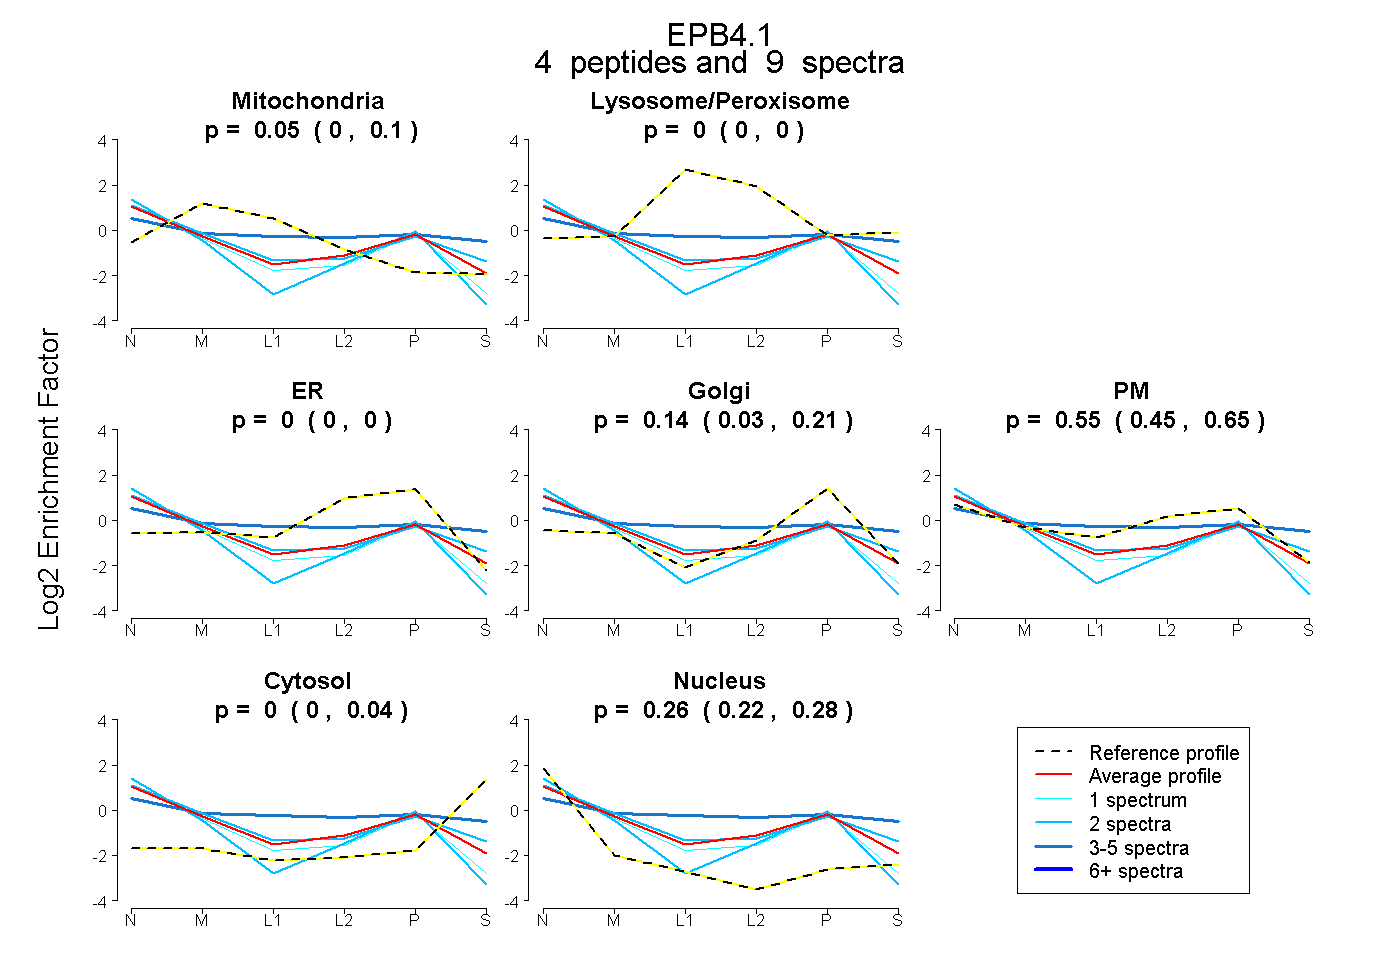
0.000 | 0.097
0.000 | 0.000
0.000 | 0.000
0.030 | 0.209
0.447 | 0.648
0.000 | 0.038
0.218 | 0.284
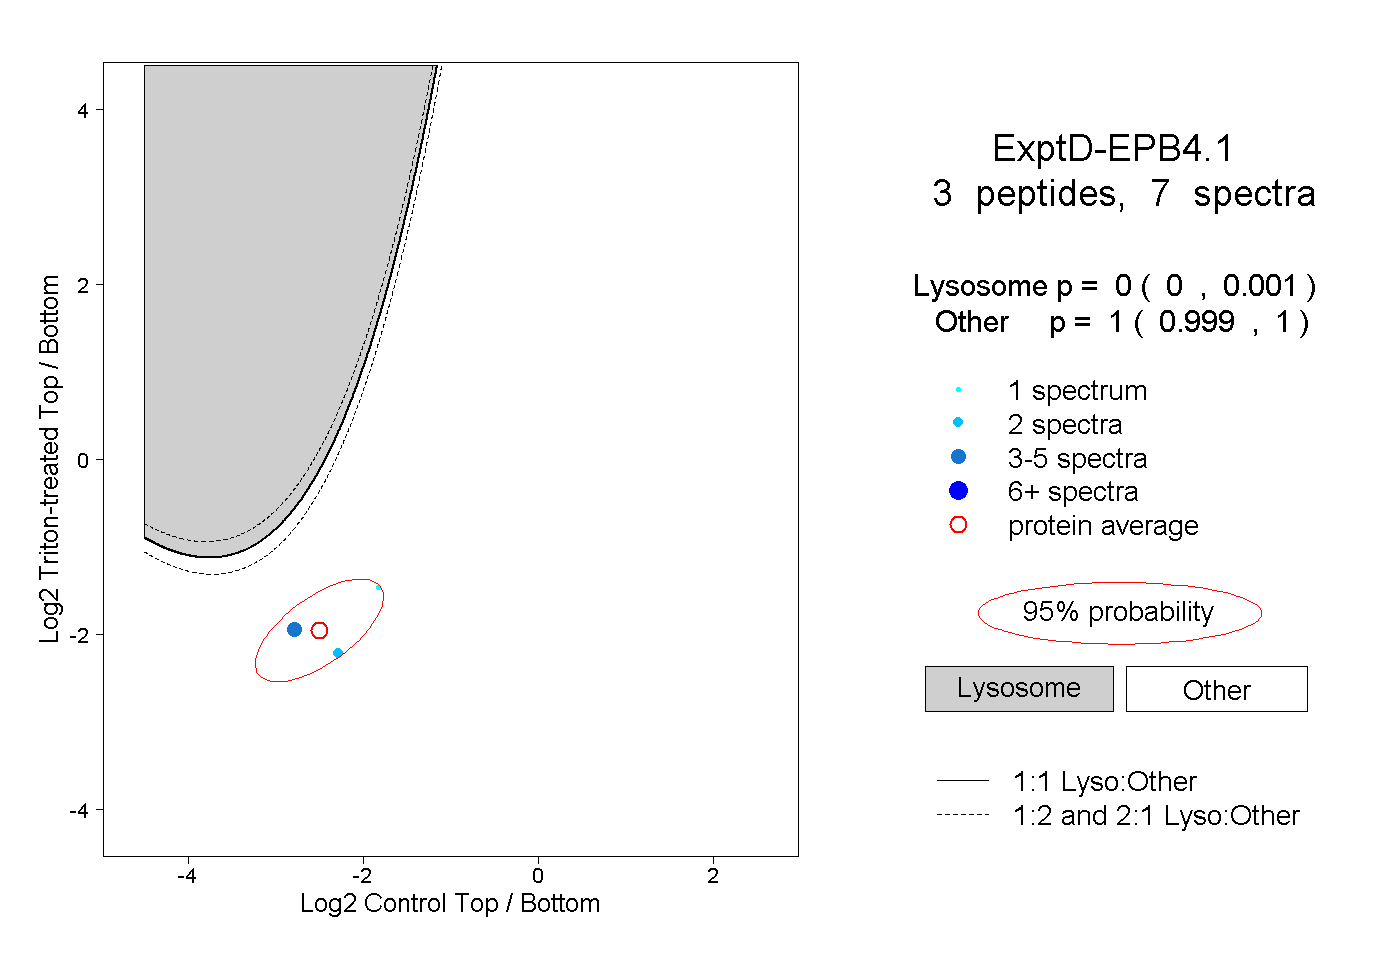
16peptides
spectra
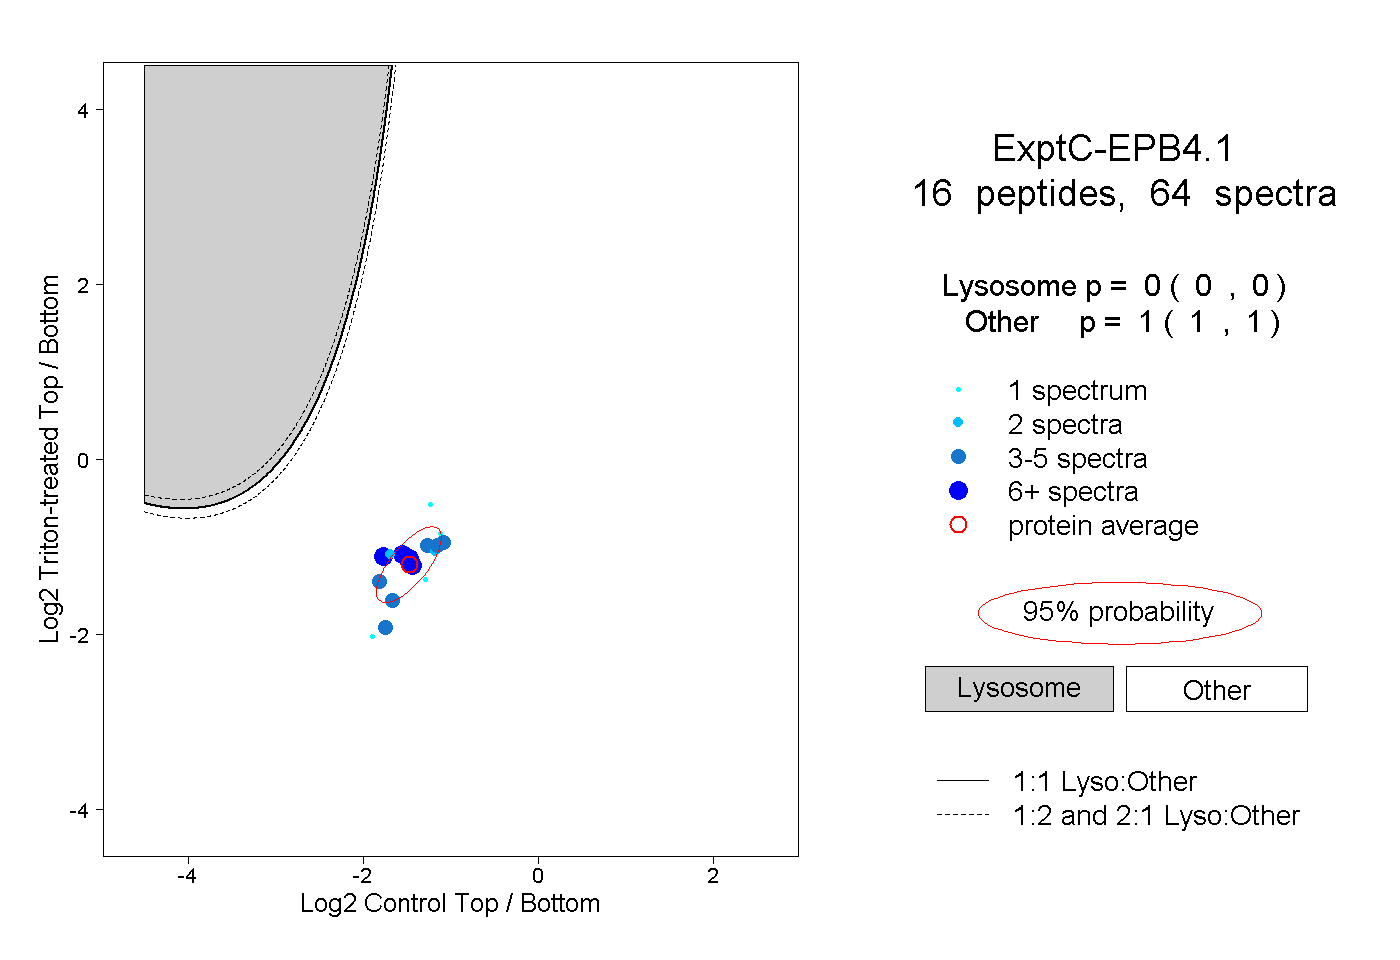
0.000 | 0.000
1.000 | 1.000