 10
10peptides
spectra

0.000 | 0.000
0.216 | 0.239
0.577 | 0.602
0.052 | 0.078
0.000 | 0.000
0.094 | 0.130
0.000 | 0.000
0.000 | 0.000
7peptides
spectra
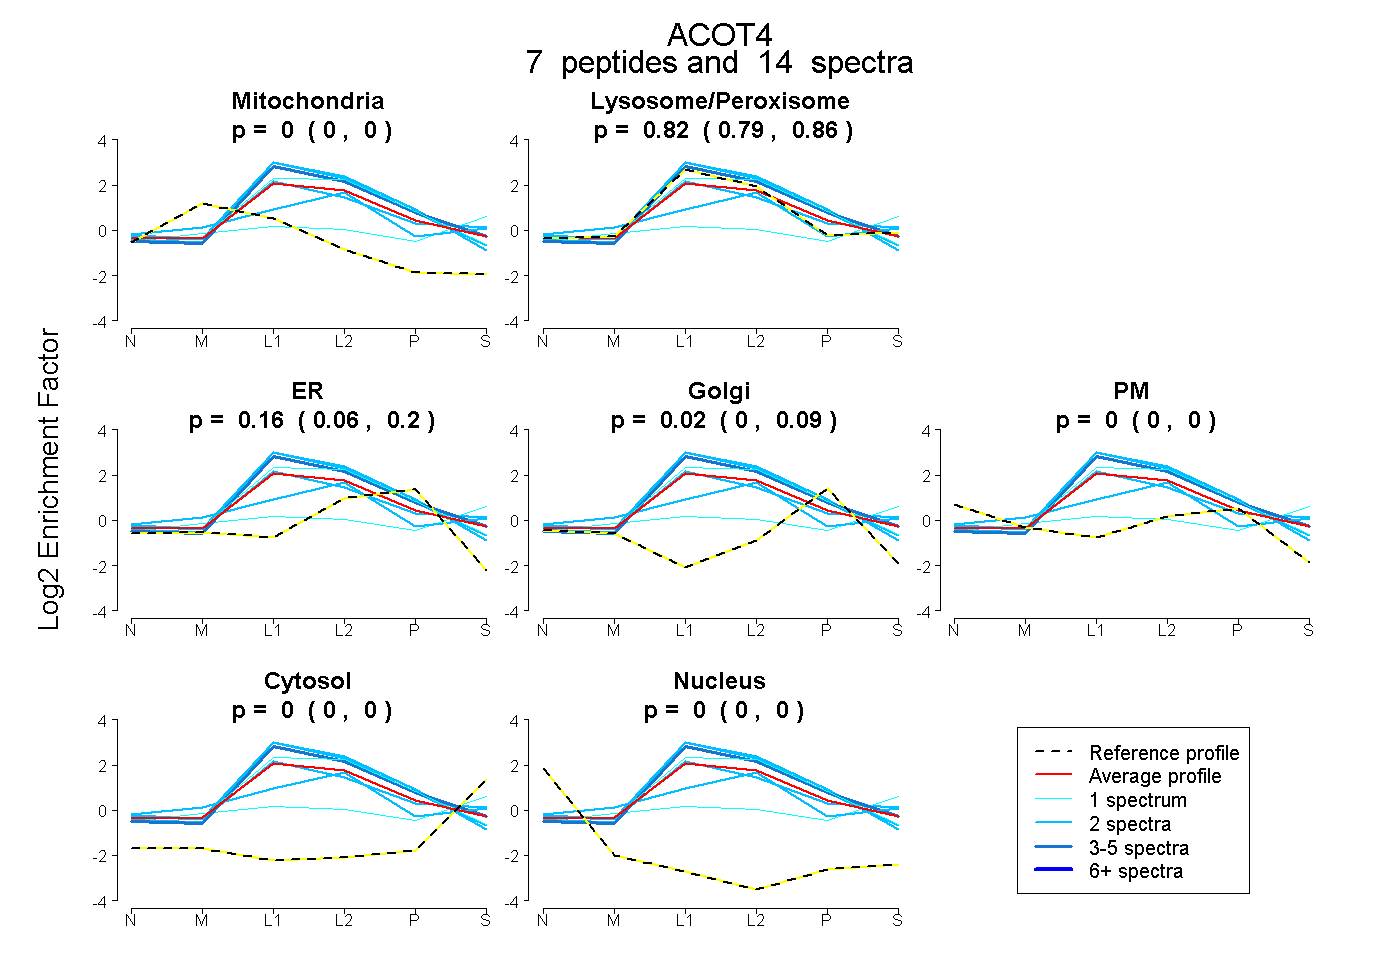
0.000 | 0.000
0.786 | 0.856
0.062 | 0.200
0.000 | 0.086
0.000 | 0.000
0.000 | 0.000
0.000 | 0.000
10peptides
spectra
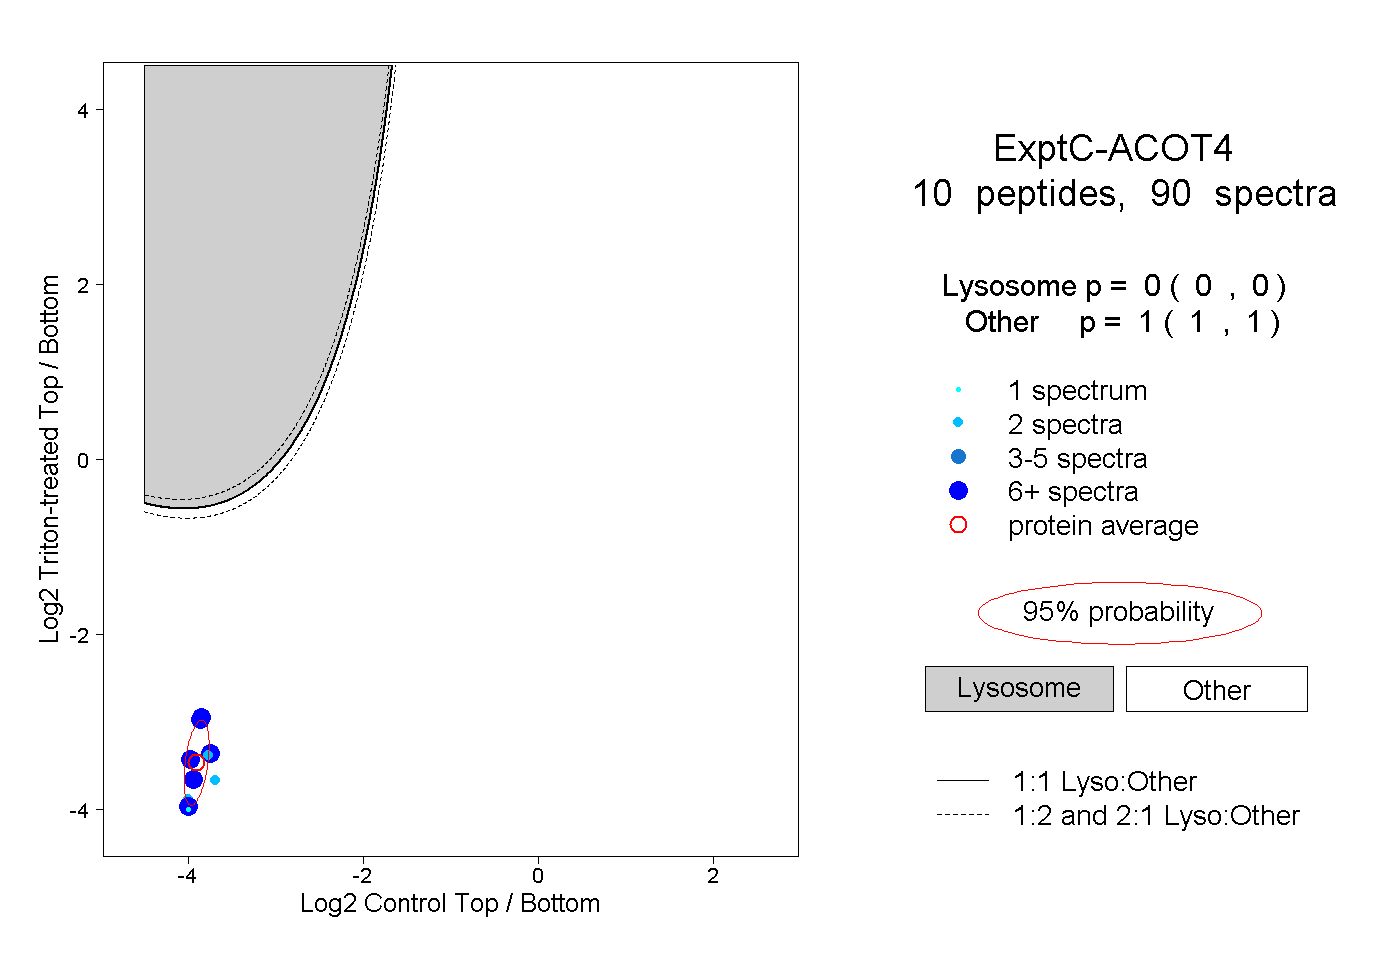
0.000 | 0.000
1.000 | 1.000
6peptides
spectra
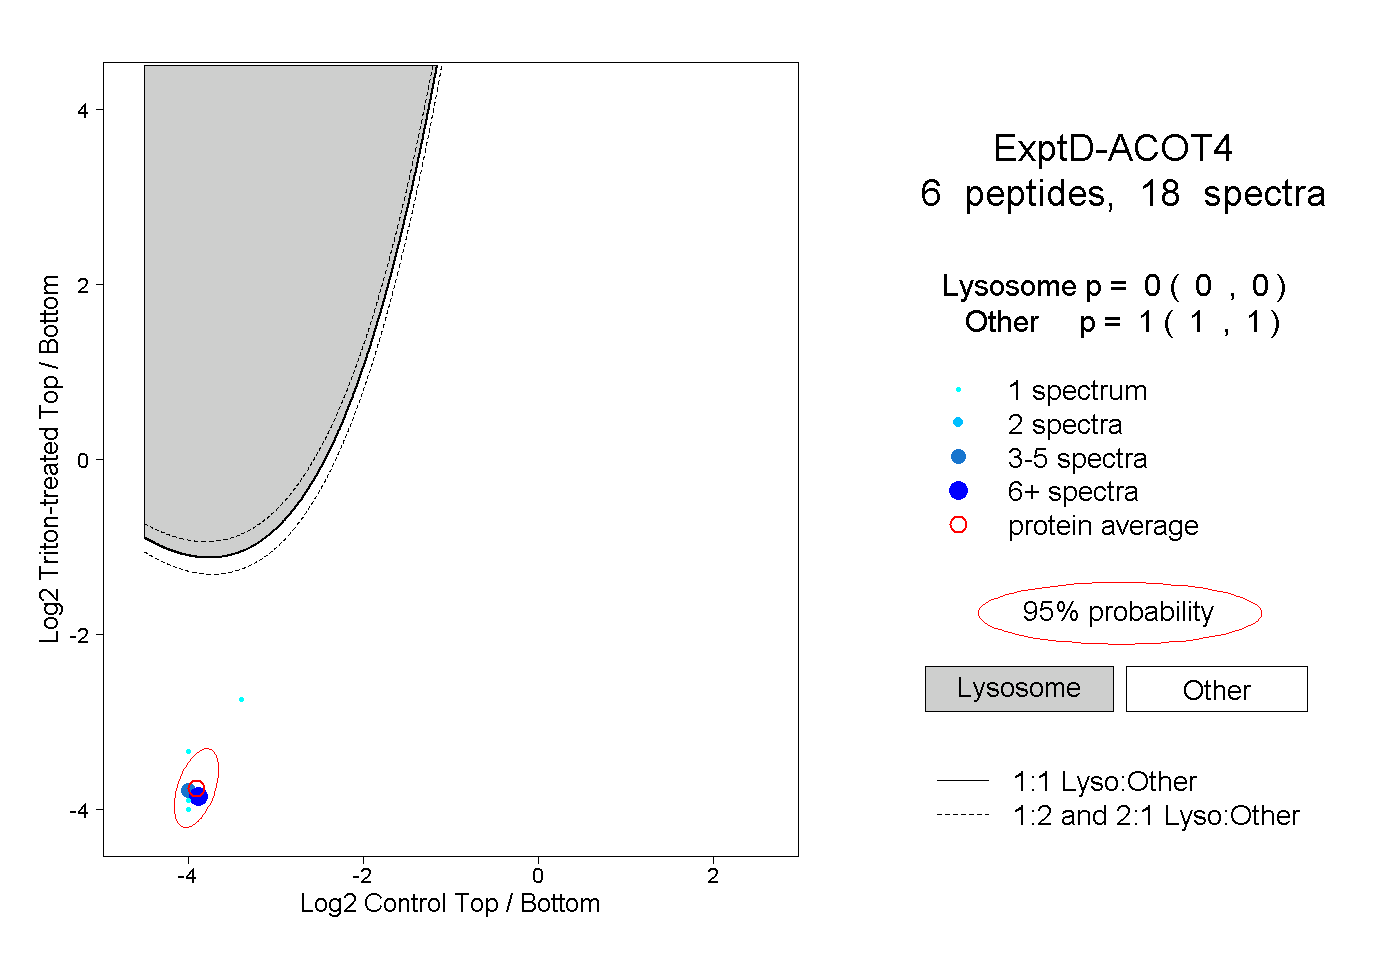
0.000 | 0.000
1.000 | 1.000