 2
2peptides
spectra
0.000 | 0.000
0.000 | 0.192
0.000 | 0.088
0.000 | 0.013
0.151 | 0.621
0.000 | 0.440
0.002 | 0.342
0.000 | 0.073
1peptide
spectrum
NA | NA
NA | NA
| Plot | Mito | Lyso | Perox | ER | Golgi | PM | Cytosol | Nucleus | |||||
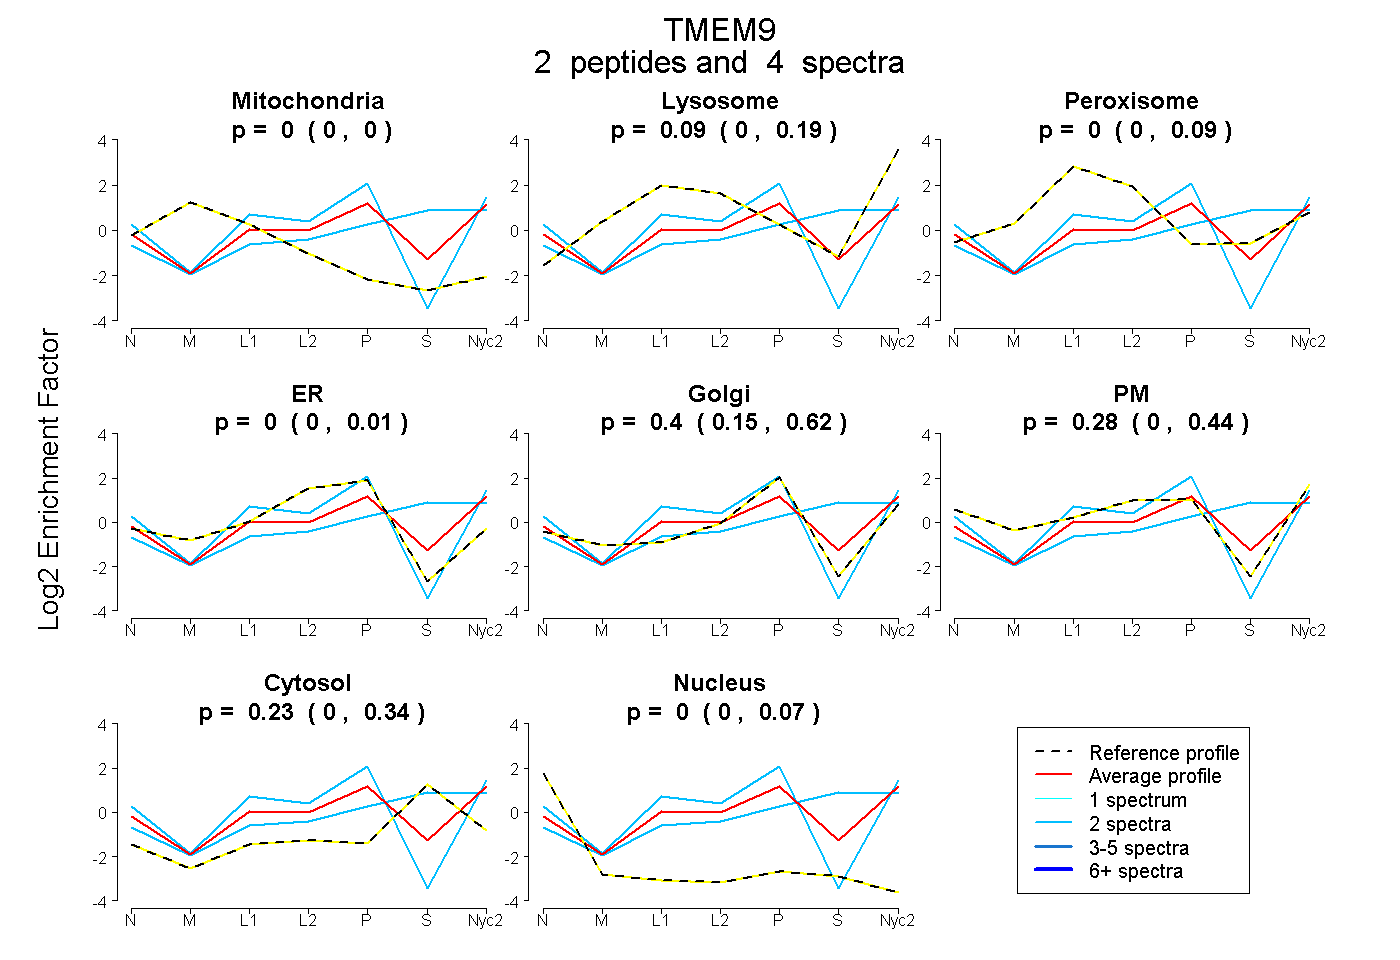
| Expt A |
2 peptides |
4 spectra |
|
0.000 0.000 | 0.000 |
0.089 0.000 | 0.192 |
0.000 0.000 | 0.088 |
0.000 0.000 | 0.013 |
0.401 0.151 | 0.621 |
0.282 0.000 | 0.440 |
0.228 0.002 | 0.342 |
0.000 0.000 | 0.073 |
||
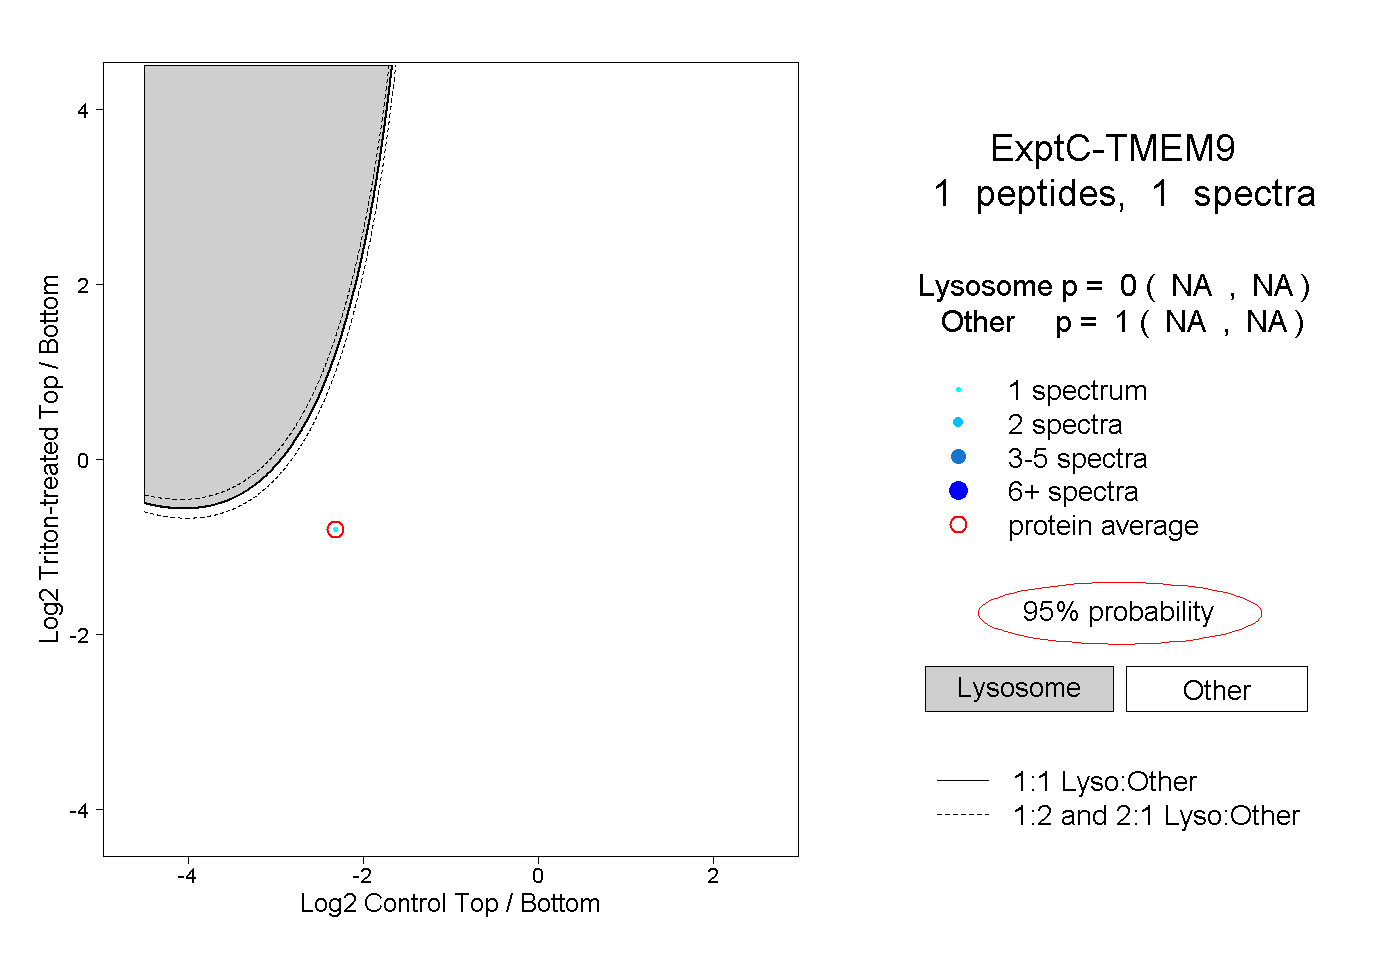
| Plot | Lyso | Other | |||||||||||
| Expt C |
1 peptide |
1 spectrum |
|
0.000 NA | NA |
1.000 NA | NA |