 3
3peptides
spectra
0.000 | 0.000
0.000 | 0.094
0.000 | 0.194
0.000 | 0.221
0.000 | 0.226
0.000 | 0.085
0.605 | 0.721
0.000 | 0.000
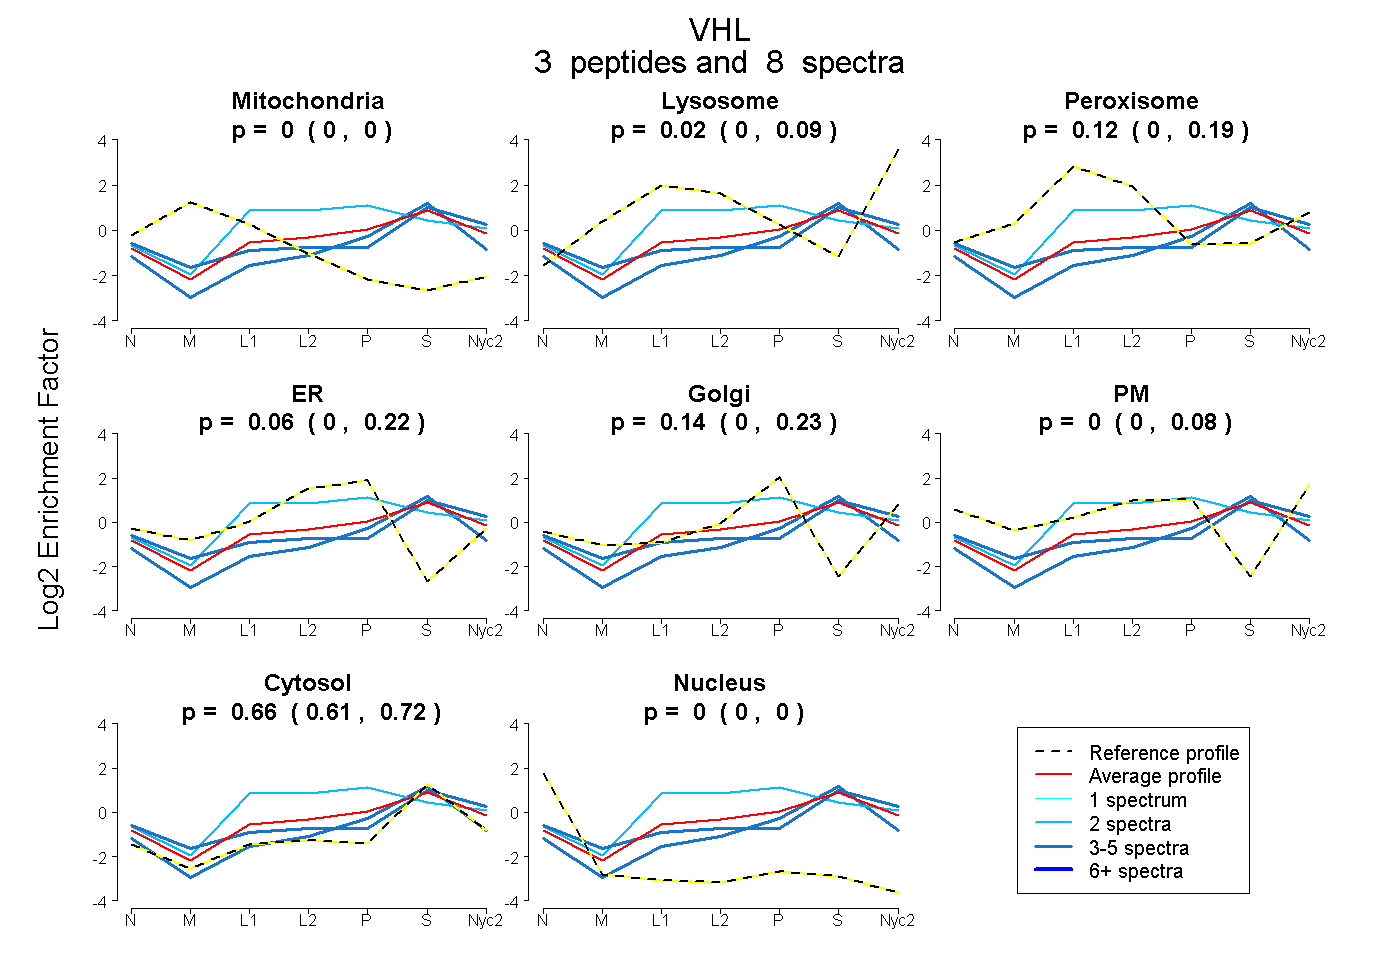
| Plot | Mito | Lyso | Perox | ER | Golgi | PM | Cytosol | Nucleus | |||||
| Expt A |
3 peptides |
8 spectra |
|
0.000 0.000 | 0.000 |
0.020 0.000 | 0.094 |
0.119 0.000 | 0.194 |
0.064 0.000 | 0.221 |
0.136 0.000 | 0.226 |
0.000 0.000 | 0.085 |
0.661 0.605 | 0.721 |
0.000 0.000 | 0.000 |
| 3 spectra, GHLWLFR | 0.000 | 0.000 | 0.000 | 0.000 | 0.119 | 0.000 | 0.881 | 0.000 | ||
| 3 spectra, SLYEDLEDHPNVR | 0.000 | 0.105 | 0.000 | 0.000 | 0.000 | 0.155 | 0.740 | 0.000 | ||
| 2 spectra, LTQEHLENQALGEEPEGVH | 0.000 | 0.040 | 0.269 | 0.322 | 0.000 | 0.000 | 0.368 | 0.000 |