 2
2peptides
spectra
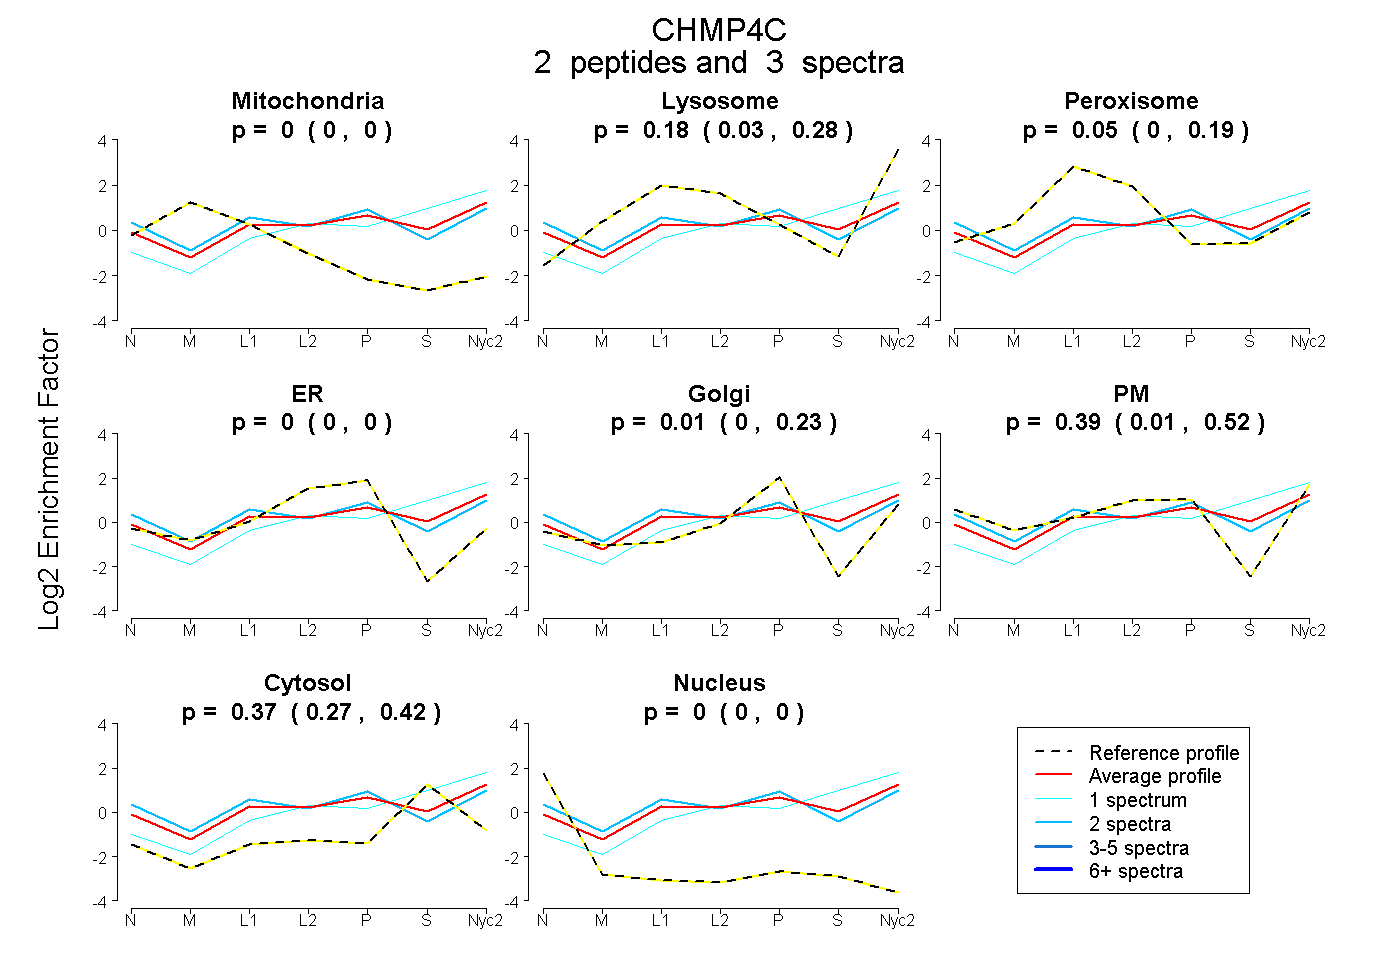
0.000 | 0.000
0.031 | 0.279
0.000 | 0.190
0.000 | 0.000
0.000 | 0.229
0.013 | 0.520
0.275 | 0.420
0.000 | 0.000
1peptide
spectrum
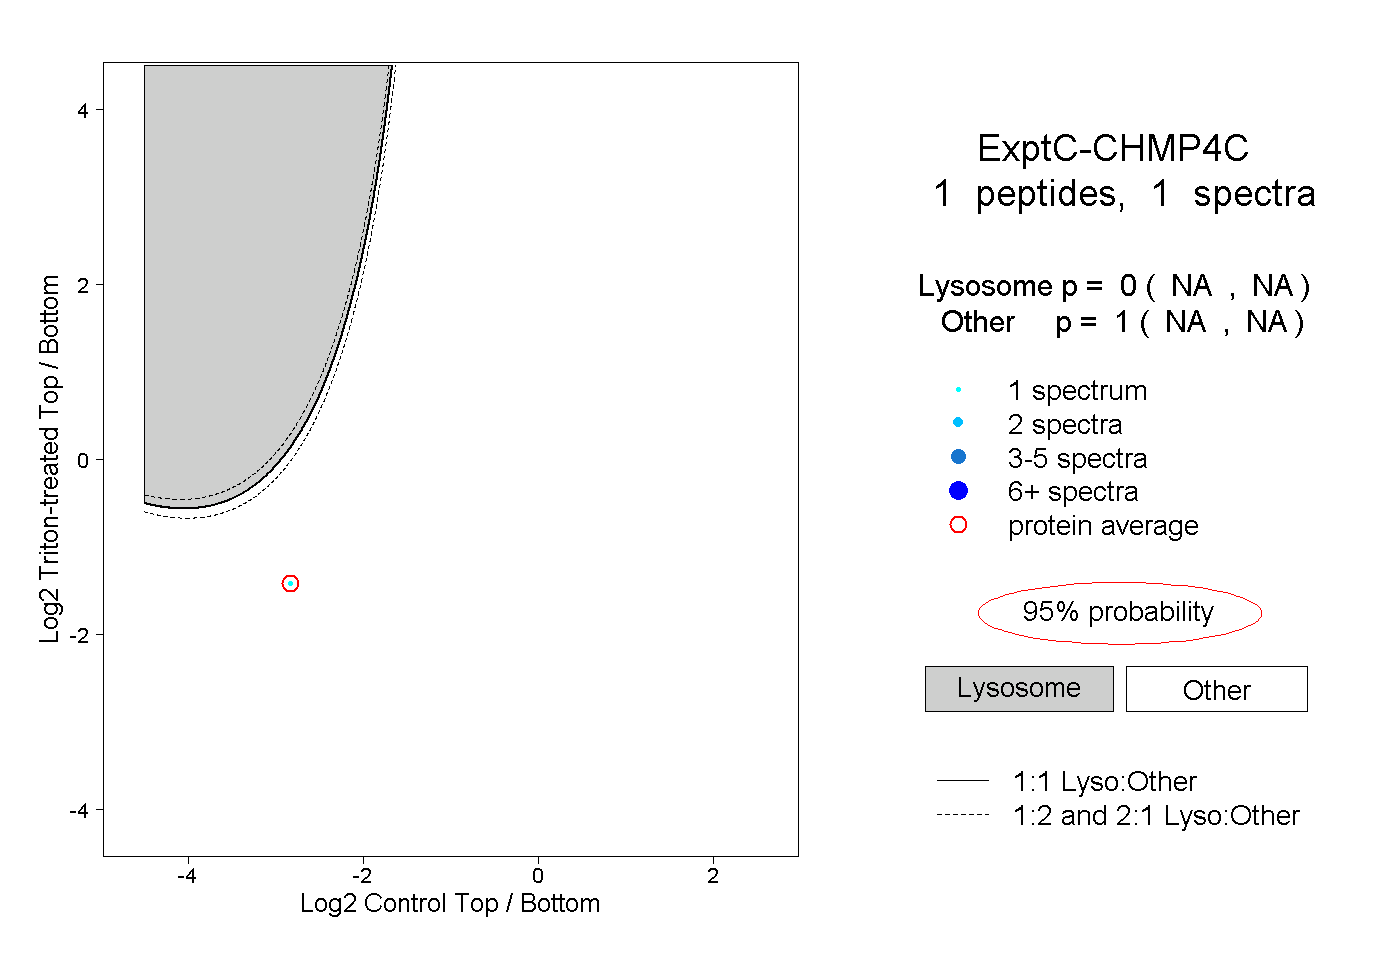
NA | NA
NA | NA
1peptide
spectrum
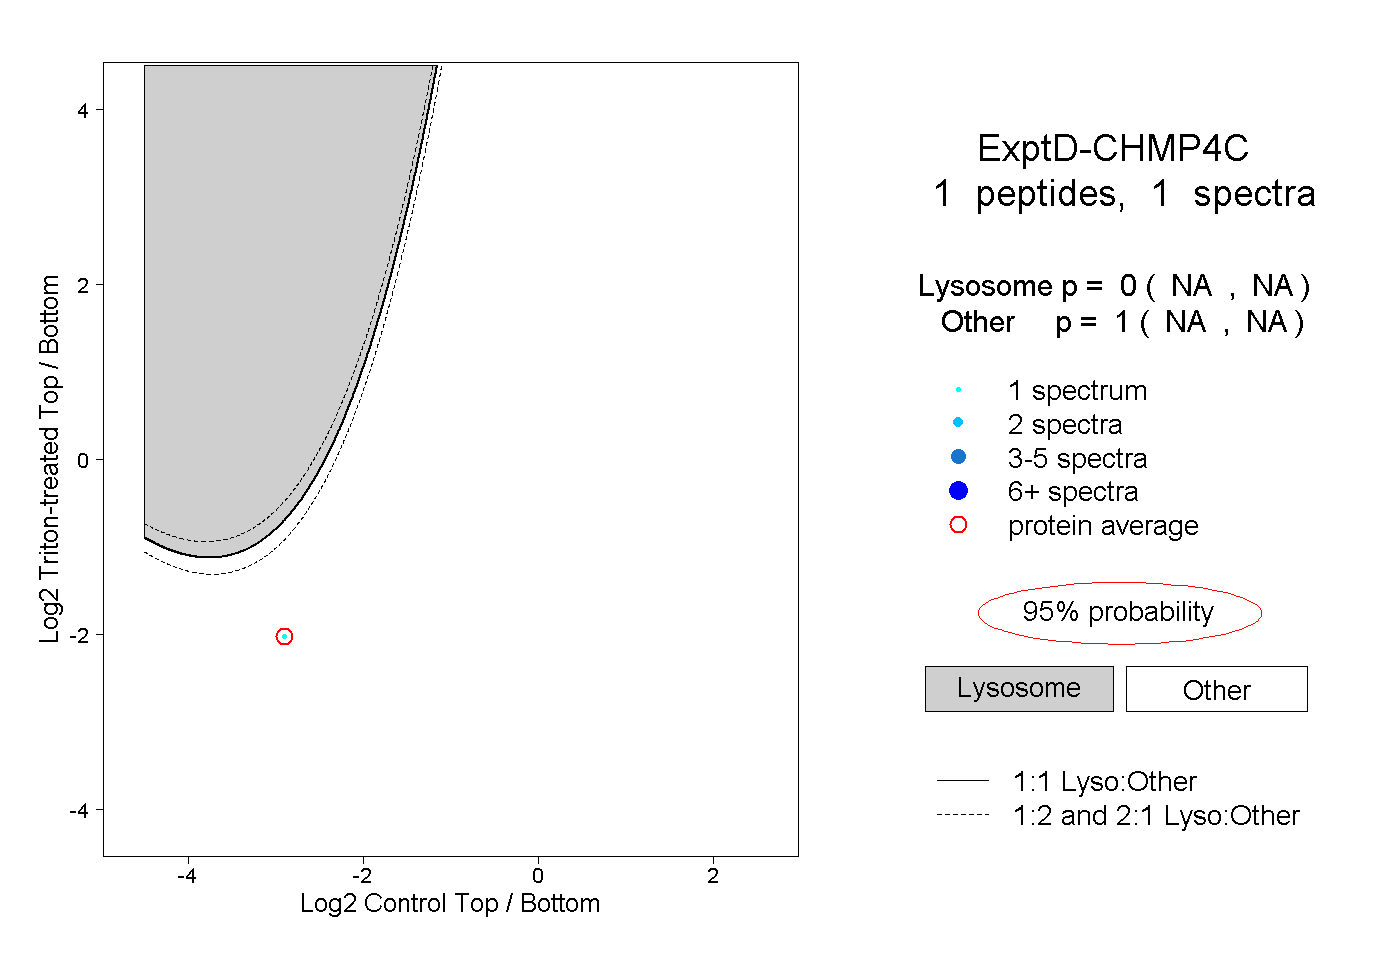
NA | NA
NA | NA