15
15peptides
spectra
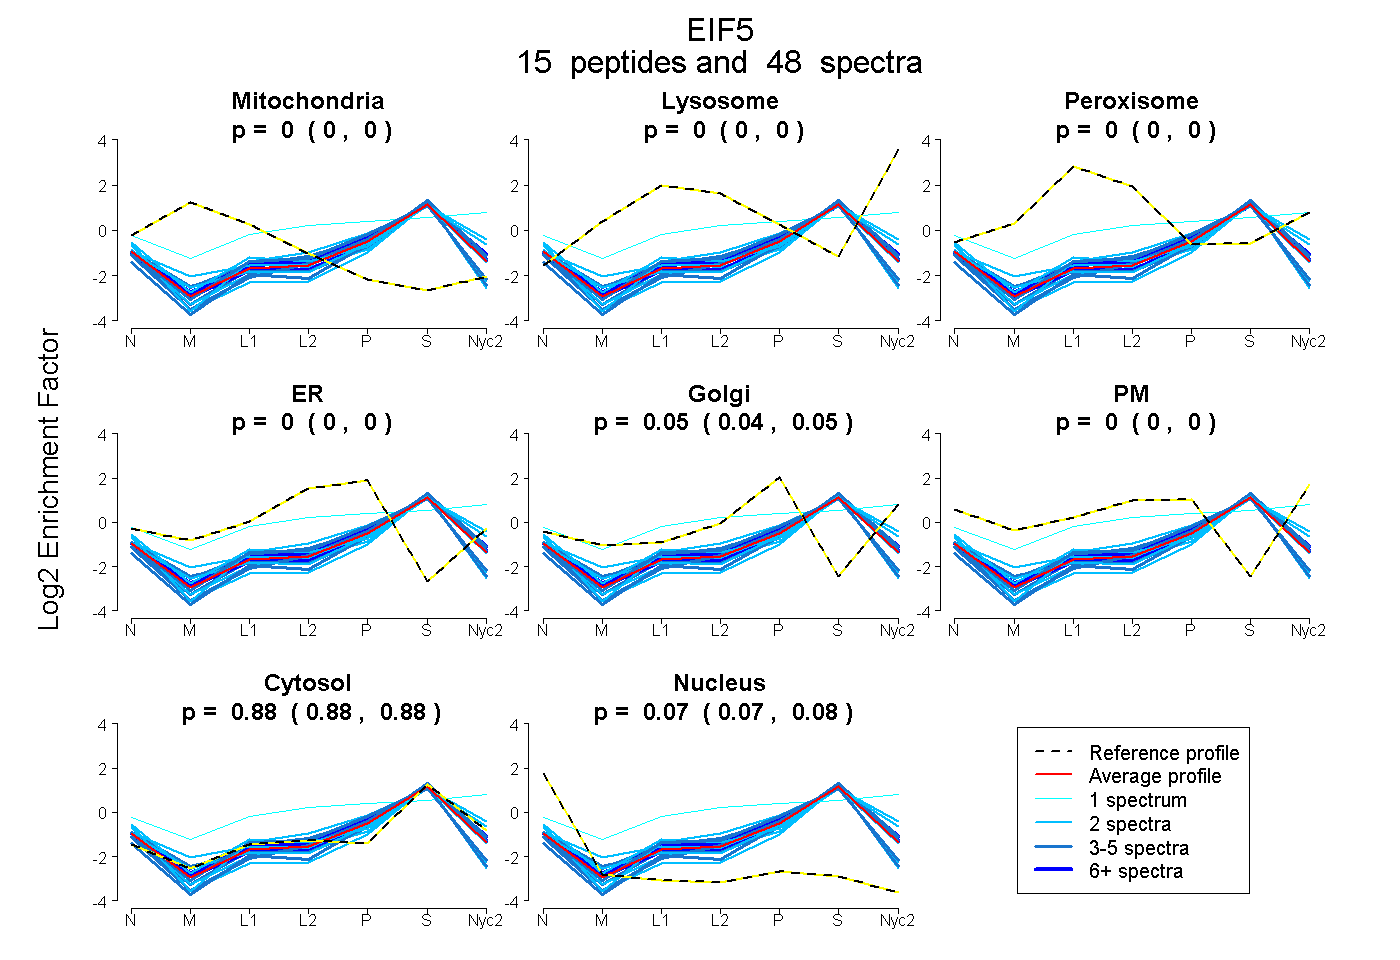
0.000 | 0.000
0.000 | 0.000
0.000 | 0.000
0.000 | 0.000
0.043 | 0.051
0.000 | 0.000
0.877 | 0.882
0.068 | 0.076
6peptides
spectra
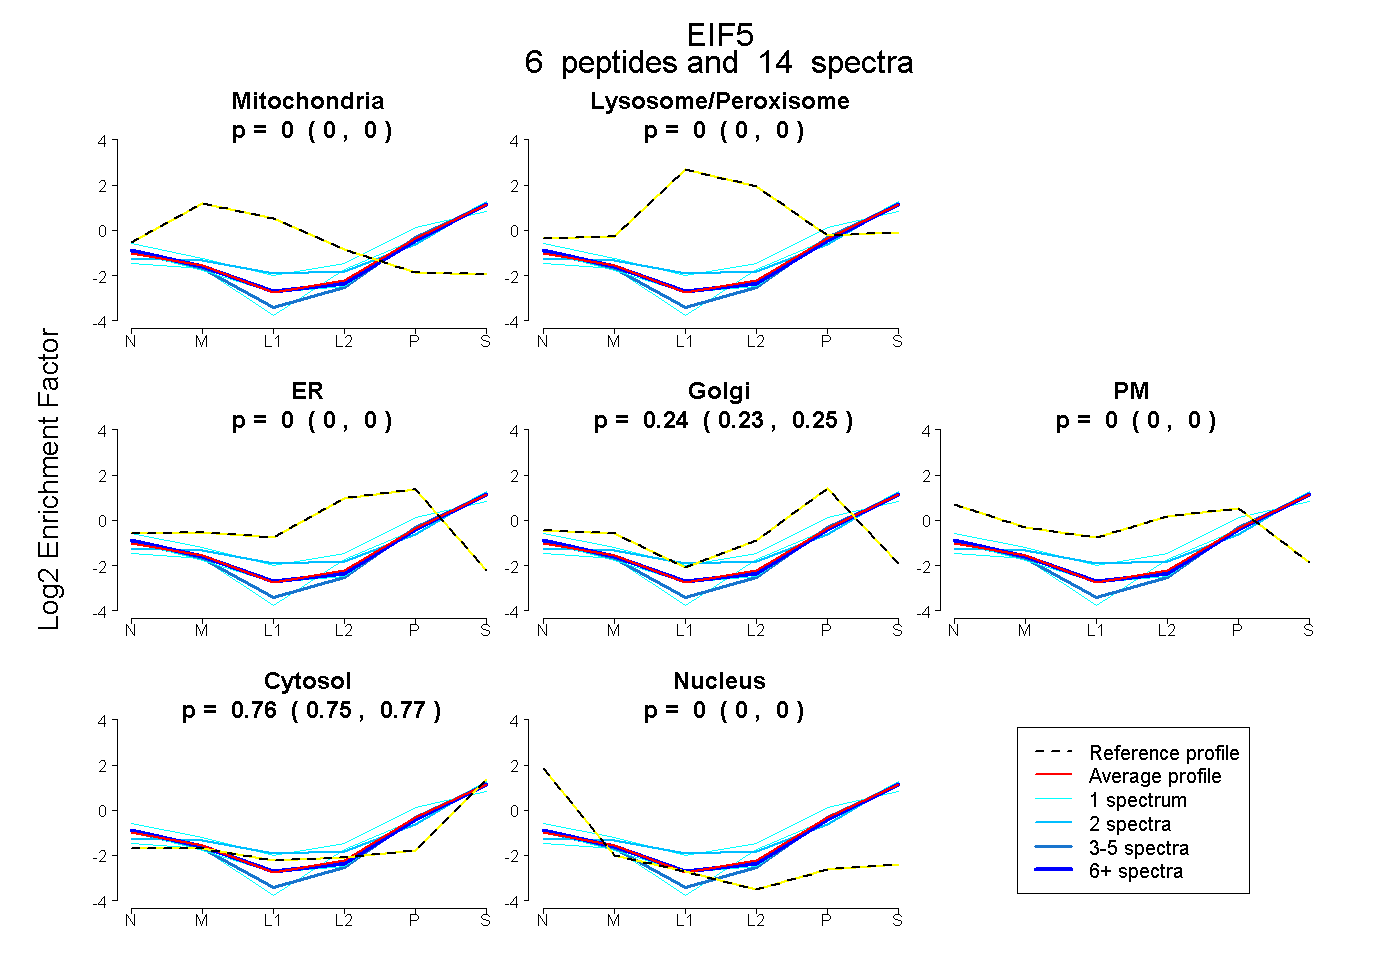
0.000 | 0.000
0.000 | 0.000
0.000 | 0.000
0.230 | 0.246
0.000 | 0.000
0.752 | 0.769
0.000 | 0.000