 15
15peptides
spectra
0.000 | 0.000
0.000 | 0.000
0.000 | 0.000
0.000 | 0.000
0.043 | 0.051
0.000 | 0.000
0.877 | 0.882
0.068 | 0.076
| Plot | Mito | Lyso | Perox | ER | Golgi | PM | Cytosol | Nucleus | |||||
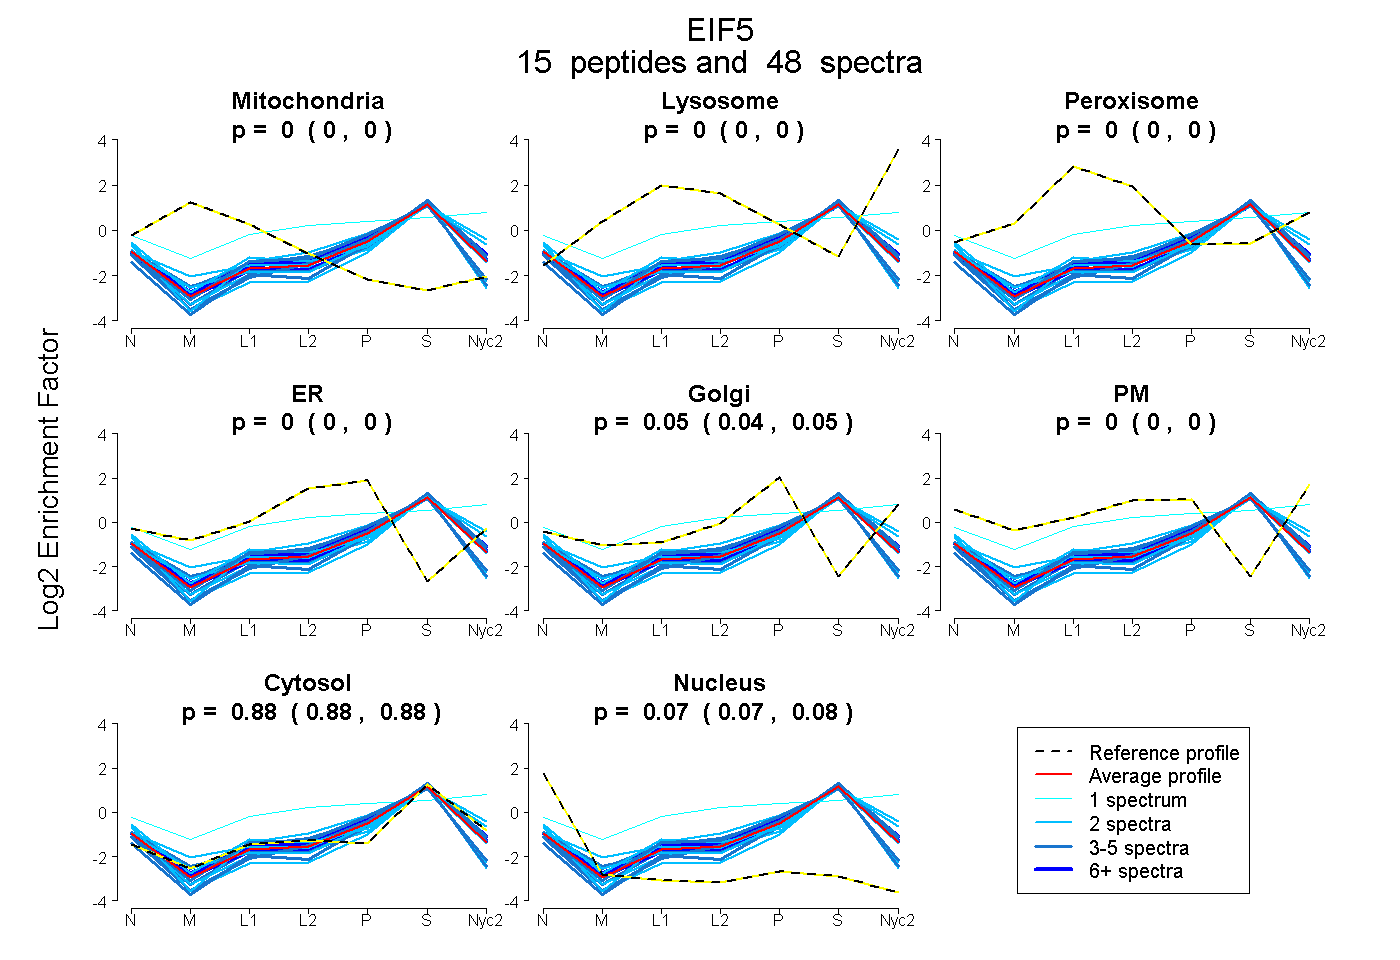
| Expt A |
15 peptides |
48 spectra |
|
0.000 0.000 | 0.000 |
0.000 0.000 | 0.000 |
0.000 0.000 | 0.000 |
0.000 0.000 | 0.000 |
0.048 0.043 | 0.051 |
0.000 0.000 | 0.000 |
0.880 0.877 | 0.882 |
0.072 0.068 | 0.076 |
| 3 spectra, LQDMLDGFIK | 0.000 | 0.000 | 0.000 | 0.000 | 0.000 | 0.000 | 0.946 | 0.054 | ||
| 3 spectra, IVLCPECENPETDLHVNPK | 0.000 | 0.000 | 0.000 | 0.000 | 0.000 | 0.000 | 0.860 | 0.140 | ||
| 2 spectra, NPPENSDIGTGK | 0.000 | 0.000 | 0.000 | 0.000 | 0.051 | 0.069 | 0.865 | 0.015 | ||
| 1 spectrum, QTIGNSCK | 0.000 | 0.119 | 0.074 | 0.000 | 0.000 | 0.331 | 0.476 | 0.000 | ||
| 4 spectra, IPHILK | 0.000 | 0.000 | 0.000 | 0.000 | 0.036 | 0.000 | 0.876 | 0.088 | ||
| 2 spectra, SVSDQFYR | 0.000 | 0.000 | 0.000 | 0.000 | 0.153 | 0.000 | 0.846 | 0.001 | ||
| 2 spectra, AEPFIK | 0.000 | 0.000 | 0.000 | 0.000 | 0.000 | 0.000 | 0.848 | 0.152 | ||
| 2 spectra, LCTFILK | 0.000 | 0.000 | 0.000 | 0.010 | 0.078 | 0.000 | 0.846 | 0.066 | ||
| 2 spectra, TVIVNMVDVAK | 0.000 | 0.000 | 0.000 | 0.000 | 0.000 | 0.000 | 0.850 | 0.150 | ||
| 5 spectra, AMGPLVLTEVLFDEK | 0.000 | 0.000 | 0.000 | 0.000 | 0.000 | 0.000 | 0.923 | 0.077 | ||
| 2 spectra, FCHNNK | 0.000 | 0.000 | 0.000 | 0.000 | 0.000 | 0.000 | 0.816 | 0.184 | ||
| 4 spectra, VNILFDFVK | 0.000 | 0.000 | 0.000 | 0.076 | 0.000 | 0.000 | 0.831 | 0.092 | ||
| 6 spectra, GLTLSDDLER | 0.000 | 0.000 | 0.000 | 0.000 | 0.034 | 0.000 | 0.887 | 0.079 | ||
| 4 spectra, ALNRPPTYPTK | 0.000 | 0.000 | 0.000 | 0.102 | 0.000 | 0.000 | 0.858 | 0.040 | ||
| 6 spectra, GMLDTHHK | 0.000 | 0.000 | 0.000 | 0.000 | 0.106 | 0.000 | 0.866 | 0.028 |
| Plot | Mito | Lyso or Perox | ER | Golgi | PM | Cytosol | Nucleus | ||||||
| Expt B |
6 peptides |
14 spectra |
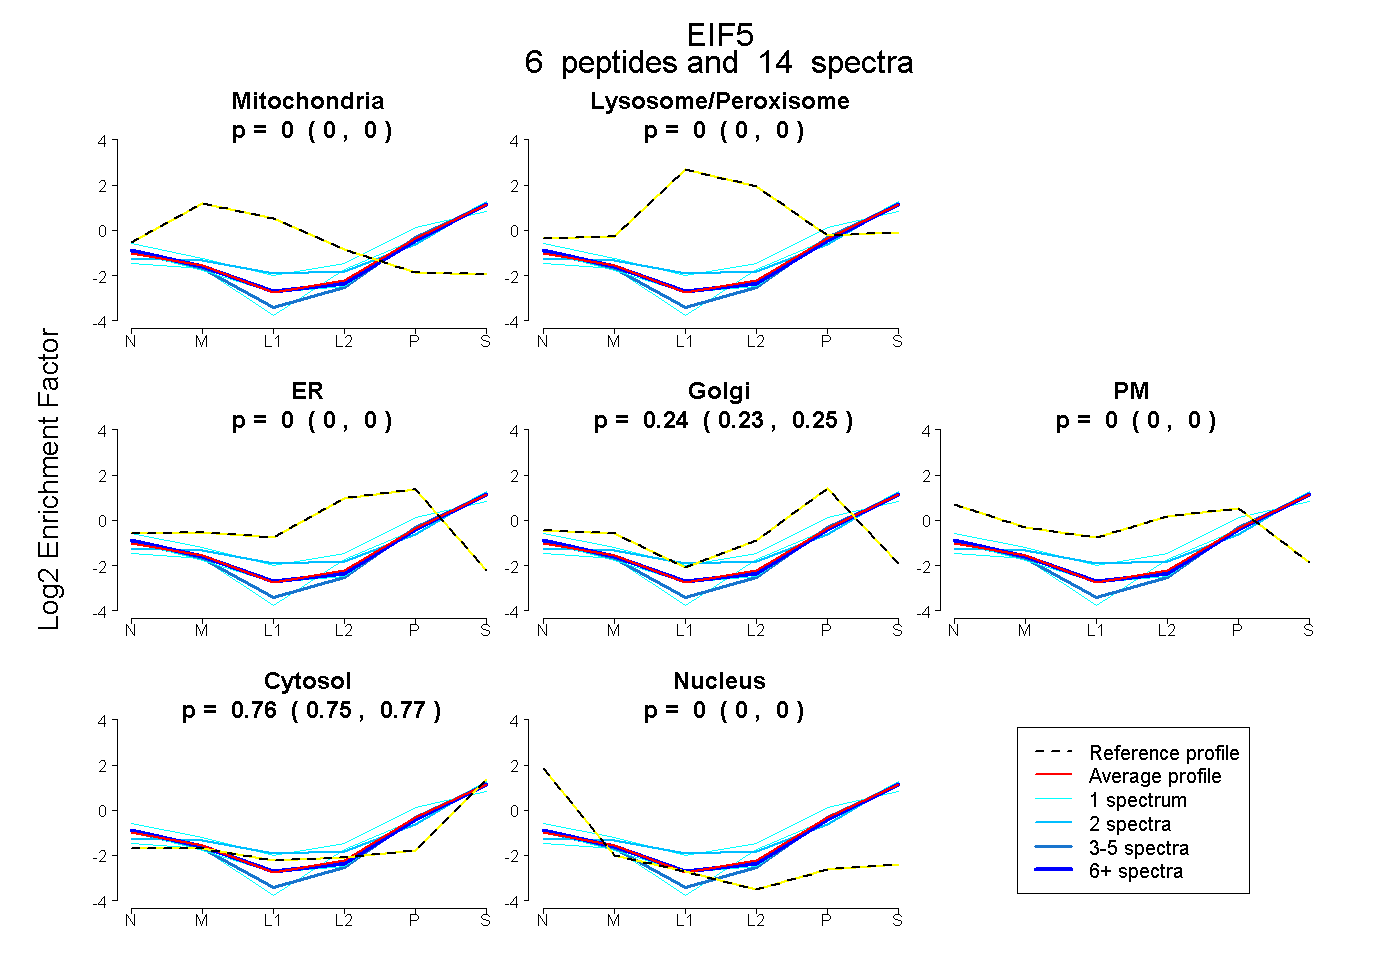 |
0.000 0.000 | 0.000 |
0.000 0.000 | 0.000 |
0.000 0.000 | 0.000 |
0.239 0.230 | 0.246 |
0.000 0.000 | 0.000 |
0.761 0.752 | 0.769 |
0.000 0.000 | 0.000 |
|||
| Plot | Lyso | Other | |||||||||||
| Expt C |
8 peptides |
34 spectra |
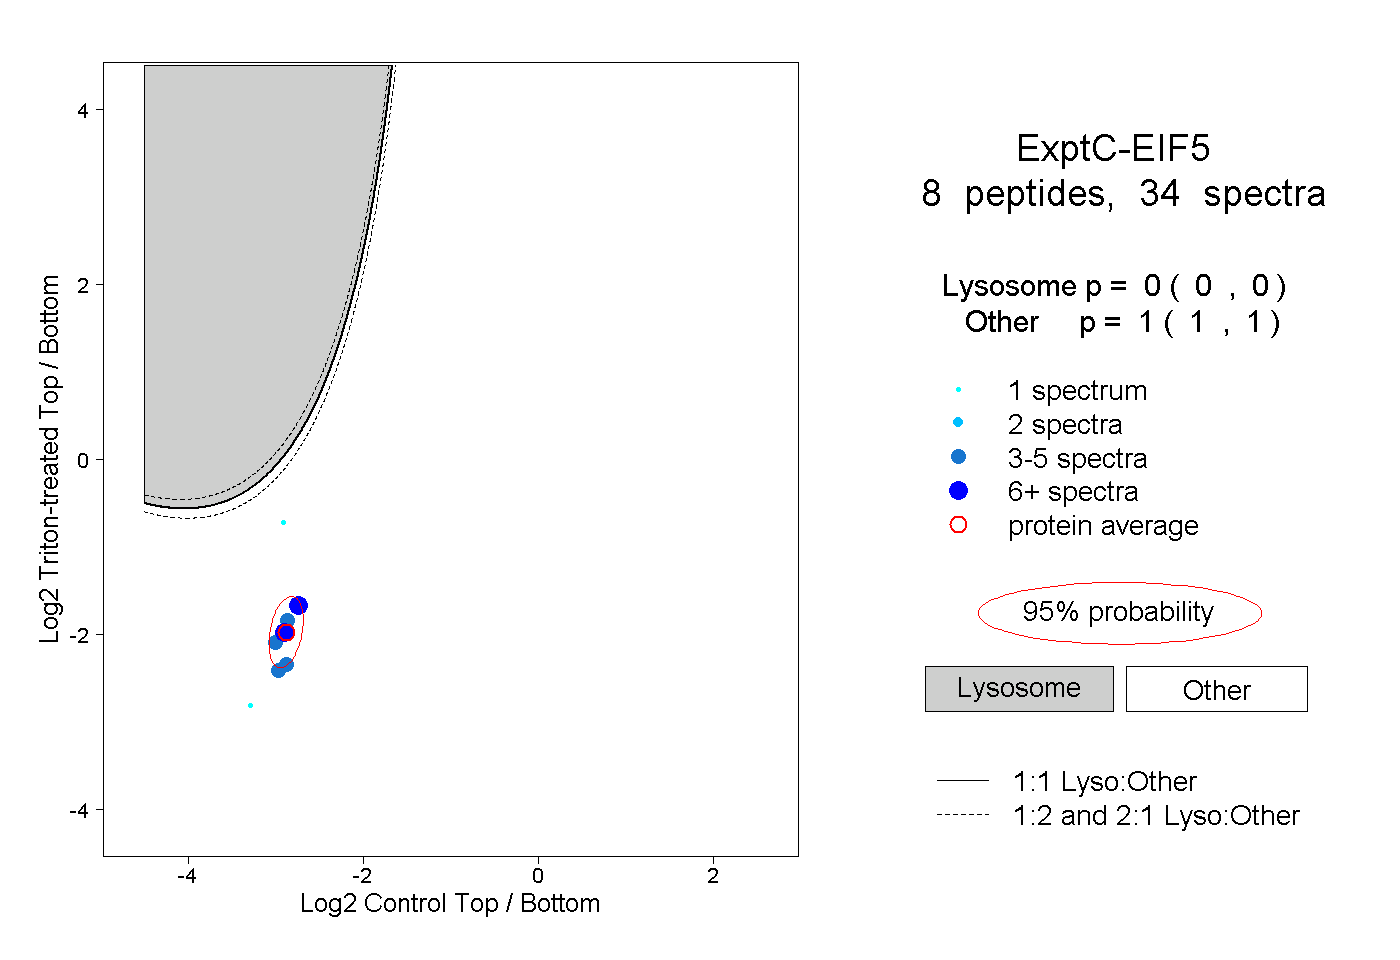 |
0.000 0.000 | 0.000 |
1.000 1.000 | 1.000 |
||||||||
| Plot | Lyso | Other | |||||||||||
| Expt D |
1 peptide |
1 spectrum |
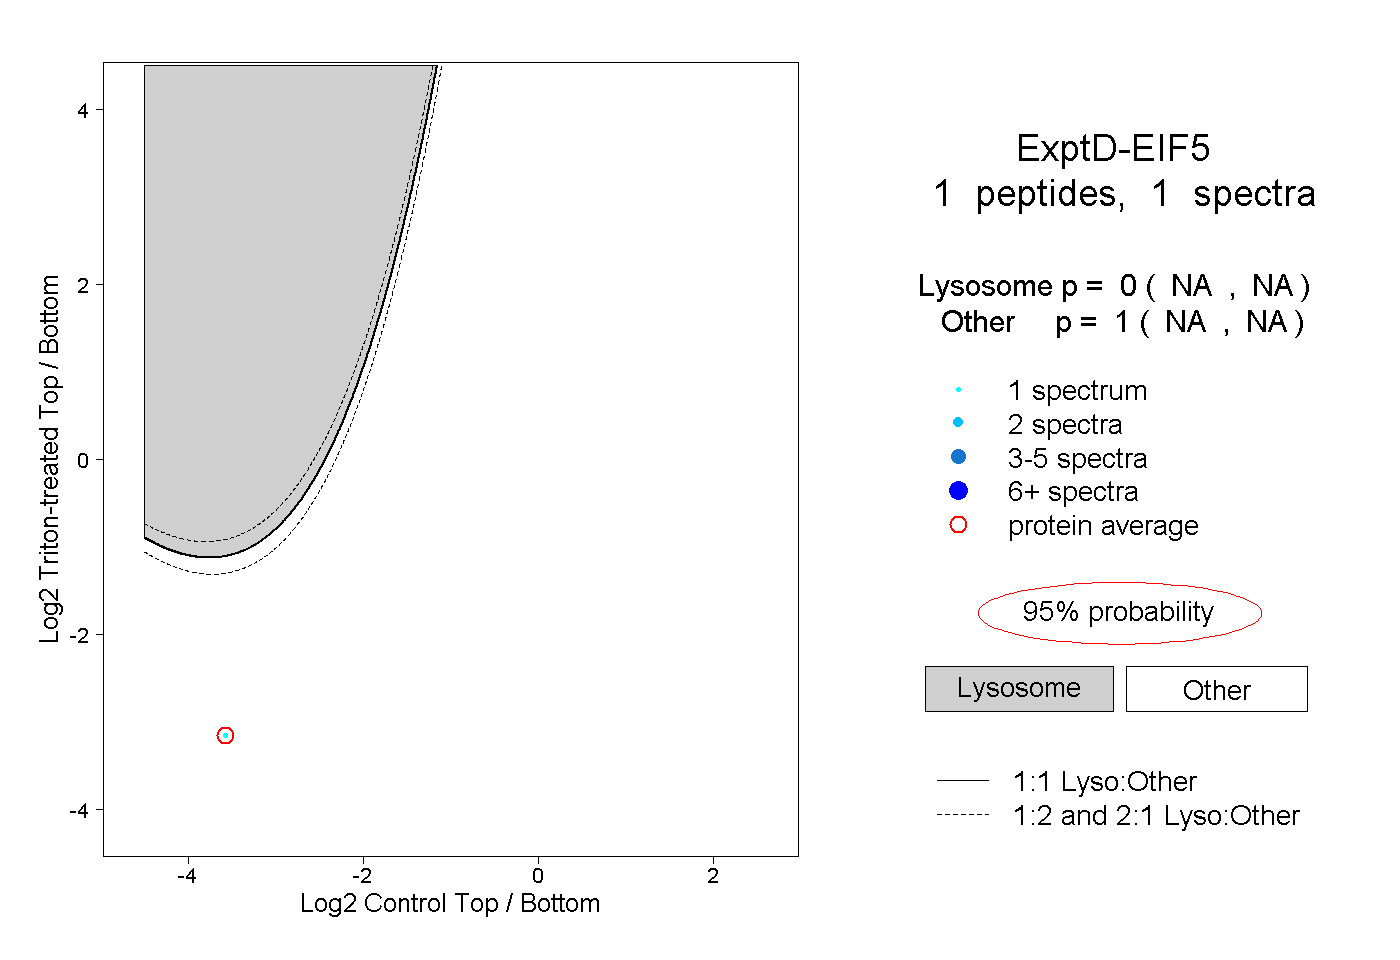 |
0.000 NA | NA |
1.000 NA | NA |