 14
14peptides
spectra
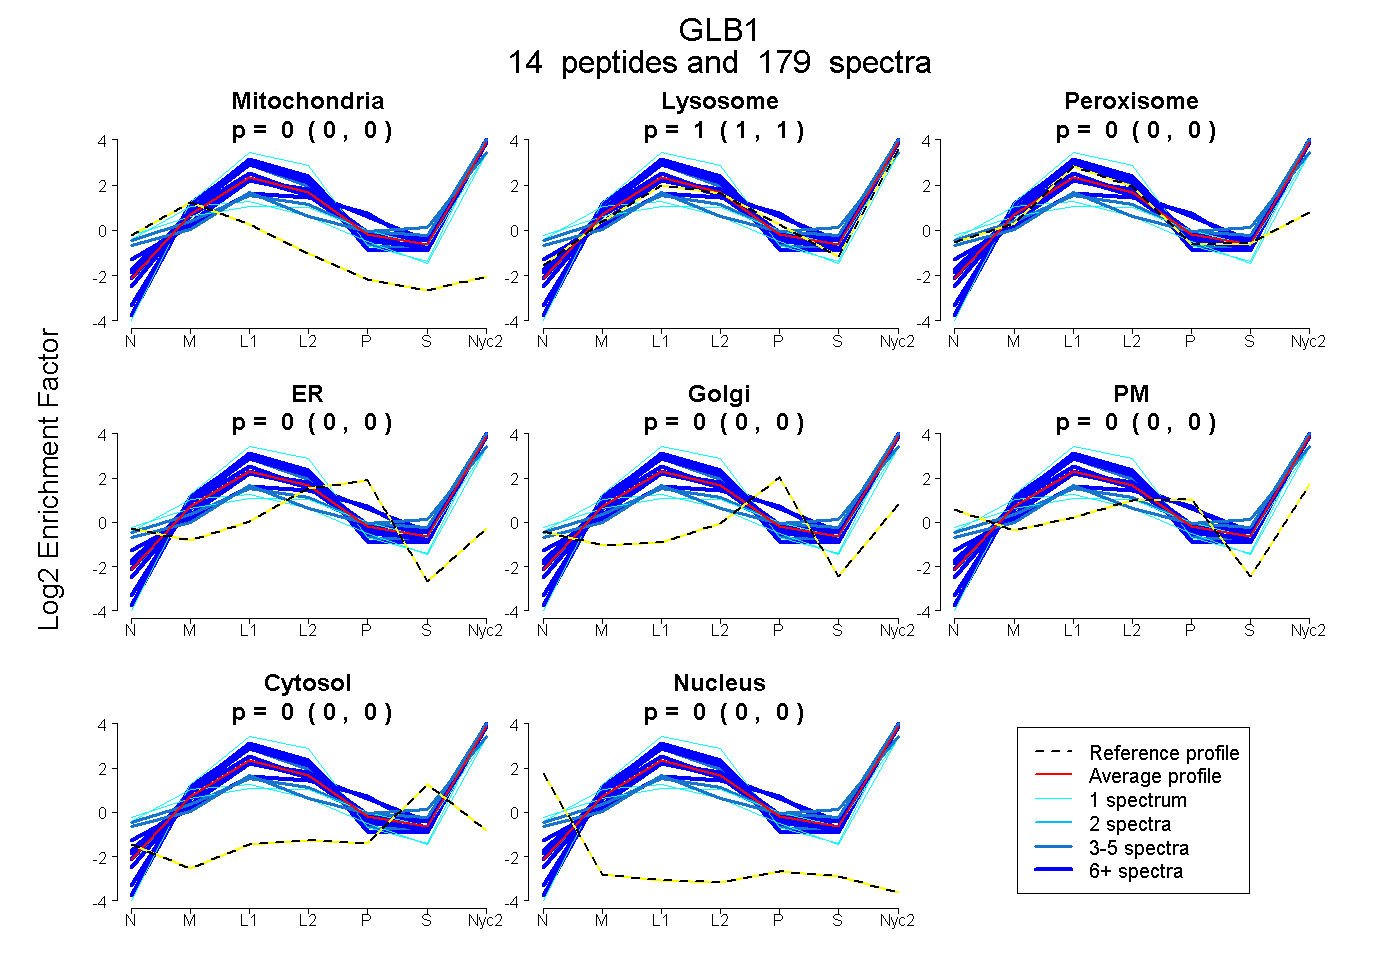
0.000 | 0.000
1.000 | 1.000
0.000 | 0.000
0.000 | 0.000
0.000 | 0.000
0.000 | 0.000
0.000 | 0.000
0.000 | 0.000
16peptides
spectra
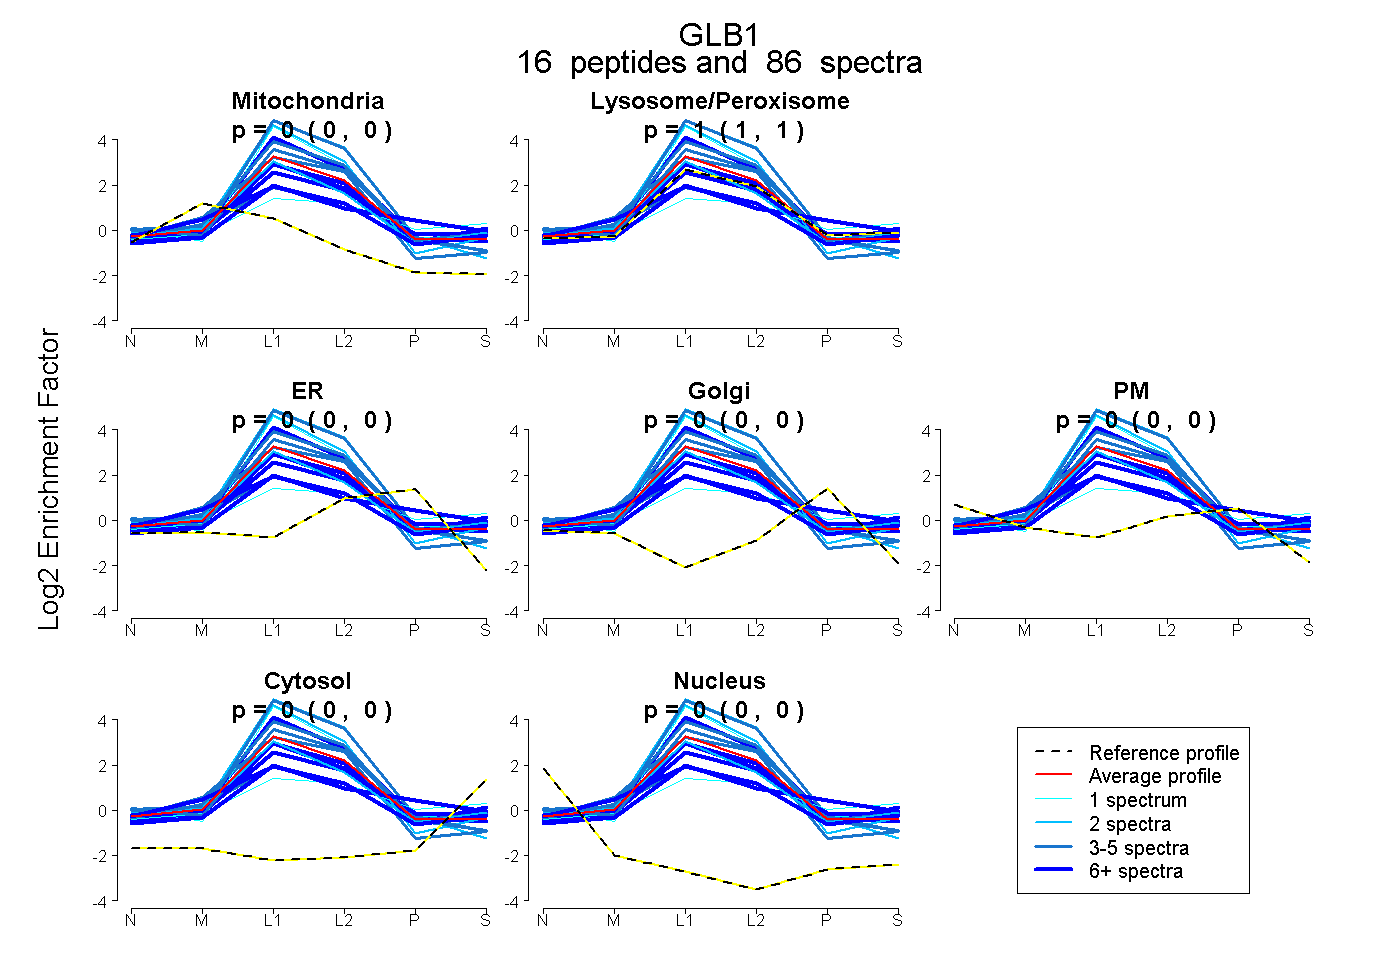
0.000 | 0.000
1.000 | 1.000
0.000 | 0.000
0.000 | 0.000
0.000 | 0.000
0.000 | 0.000
0.000 | 0.000
19peptides
spectra
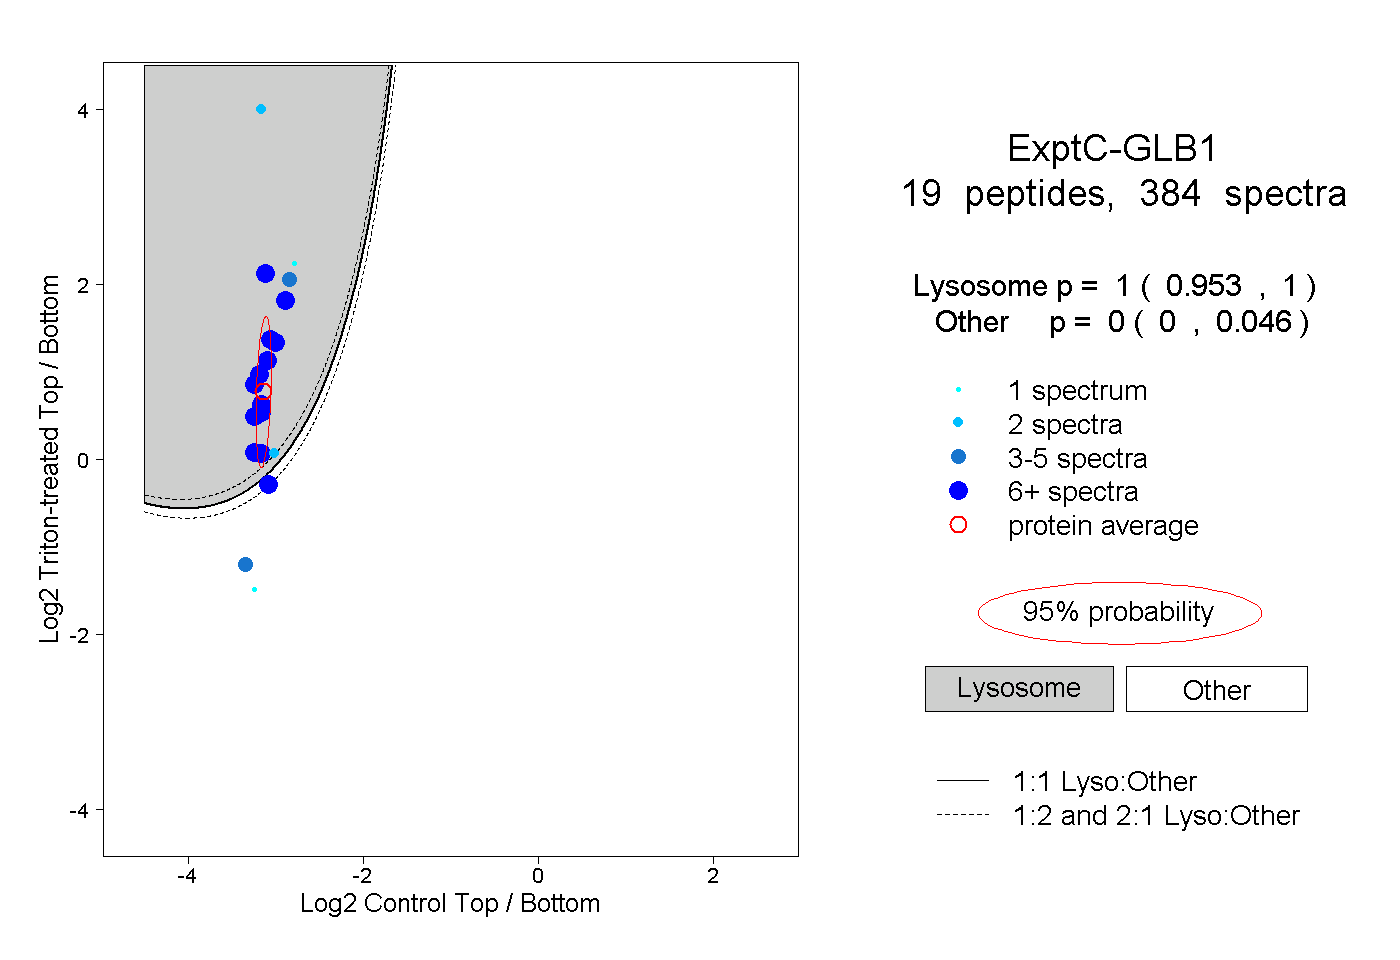
0.953 | 1.000
0.000 | 0.046
9peptides
spectra
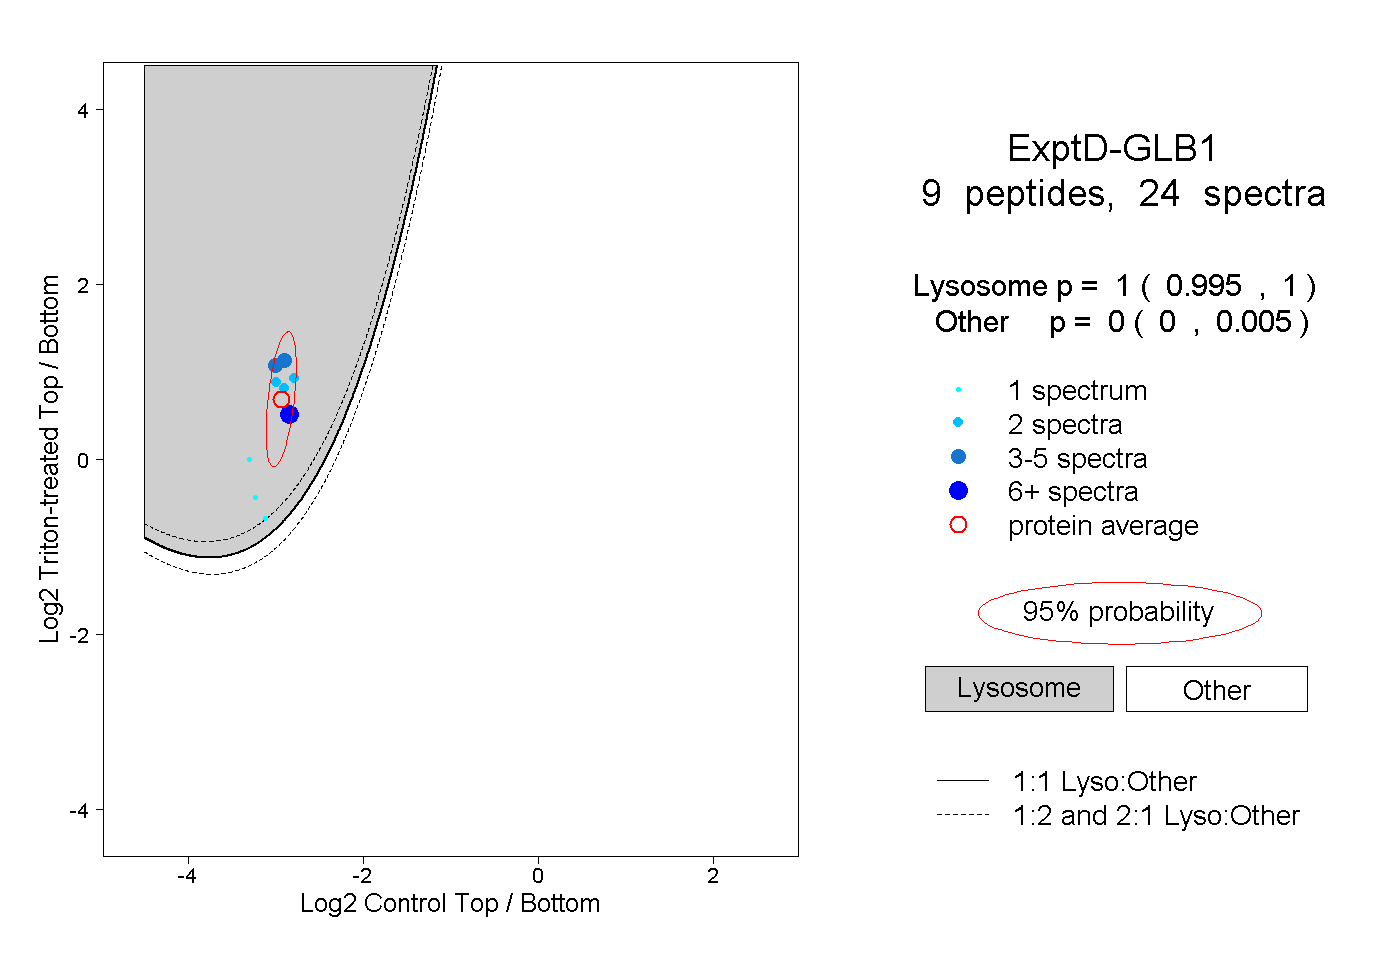
0.995 | 1.000
0.000 | 0.005