 14
14peptides
spectra
0.000 | 0.000
1.000 | 1.000
0.000 | 0.000
0.000 | 0.000
0.000 | 0.000
0.000 | 0.000
0.000 | 0.000
0.000 | 0.000
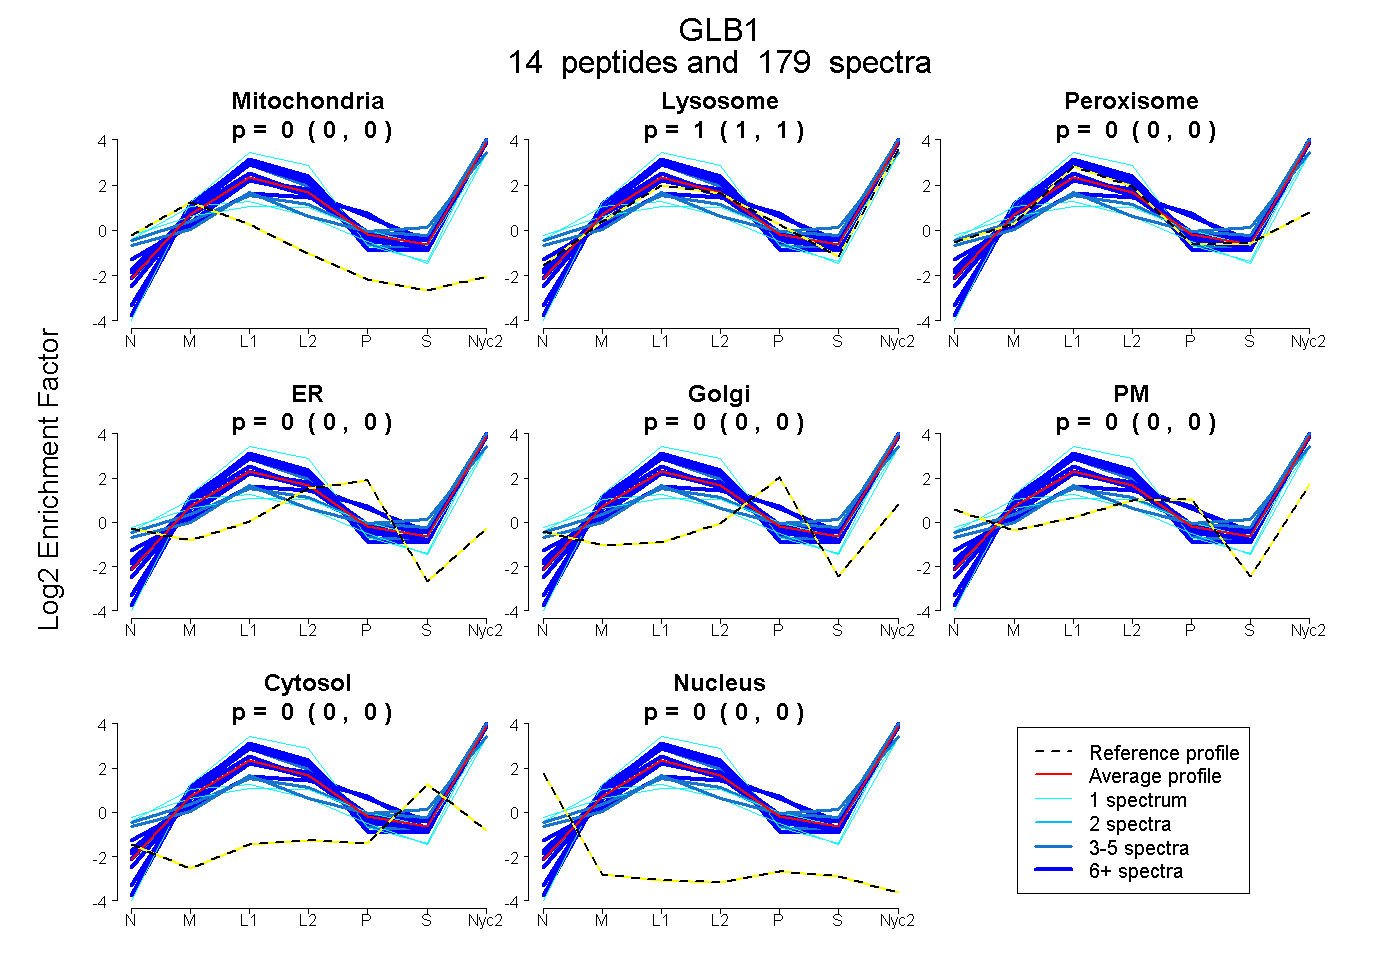
| Plot | Mito | Lyso | Perox | ER | Golgi | PM | Cytosol | Nucleus | |||||
| Expt A |
14 peptides |
179 spectra |
|
0.000 0.000 | 0.000 |
1.000 1.000 | 1.000 |
0.000 0.000 | 0.000 |
0.000 0.000 | 0.000 |
0.000 0.000 | 0.000 |
0.000 0.000 | 0.000 |
0.000 0.000 | 0.000 |
0.000 0.000 | 0.000 |
| 27 spectra, AFLIQR | 0.000 | 1.000 | 0.000 | 0.000 | 0.000 | 0.000 | 0.000 | 0.000 | ||
| 1 spectrum, SLYPLTFTQVK | 0.140 | 0.761 | 0.000 | 0.000 | 0.000 | 0.093 | 0.000 | 0.005 | ||
| 18 spectra, QYFGYVLYR | 0.000 | 1.000 | 0.000 | 0.000 | 0.000 | 0.000 | 0.000 | 0.000 | ||
| 4 spectra, TFELDYK | 0.000 | 0.919 | 0.000 | 0.000 | 0.000 | 0.012 | 0.069 | 0.000 | ||
| 5 spectra, AYVSVDGVPQGILDR | 0.000 | 1.000 | 0.000 | 0.000 | 0.000 | 0.000 | 0.000 | 0.000 | ||
| 13 spectra, GPQMTLFVPR | 0.000 | 1.000 | 0.000 | 0.000 | 0.000 | 0.000 | 0.000 | 0.000 | ||
| 11 spectra, SSDPDYLAAVDK | 0.000 | 0.950 | 0.000 | 0.000 | 0.050 | 0.000 | 0.000 | 0.000 | ||
| 12 spectra, AGATLDILVENMGR | 0.000 | 1.000 | 0.000 | 0.000 | 0.000 | 0.000 | 0.000 | 0.000 | ||
| 21 spectra, ESIVLR | 0.000 | 1.000 | 0.000 | 0.000 | 0.000 | 0.000 | 0.000 | 0.000 | ||
| 11 spectra, FYWEDR | 0.000 | 1.000 | 0.000 | 0.000 | 0.000 | 0.000 | 0.000 | 0.000 | ||
| 50 spectra, MNVLNIR | 0.000 | 1.000 | 0.000 | 0.000 | 0.000 | 0.000 | 0.000 | 0.000 | ||
| 1 spectrum, YHLGNDIILFTTDGAAEK | 0.000 | 0.716 | 0.000 | 0.000 | 0.000 | 0.216 | 0.067 | 0.000 | ||
| 1 spectrum, GQVWINGFNLGR | 0.000 | 1.000 | 0.000 | 0.000 | 0.000 | 0.000 | 0.000 | 0.000 | ||
| 4 spectra, YISGSLHYFR | 0.000 | 0.835 | 0.000 | 0.000 | 0.000 | 0.000 | 0.165 | 0.000 |
| Plot | Mito | Lyso or Perox | ER | Golgi | PM | Cytosol | Nucleus | ||||||
| Expt B |
16 peptides |
86 spectra |
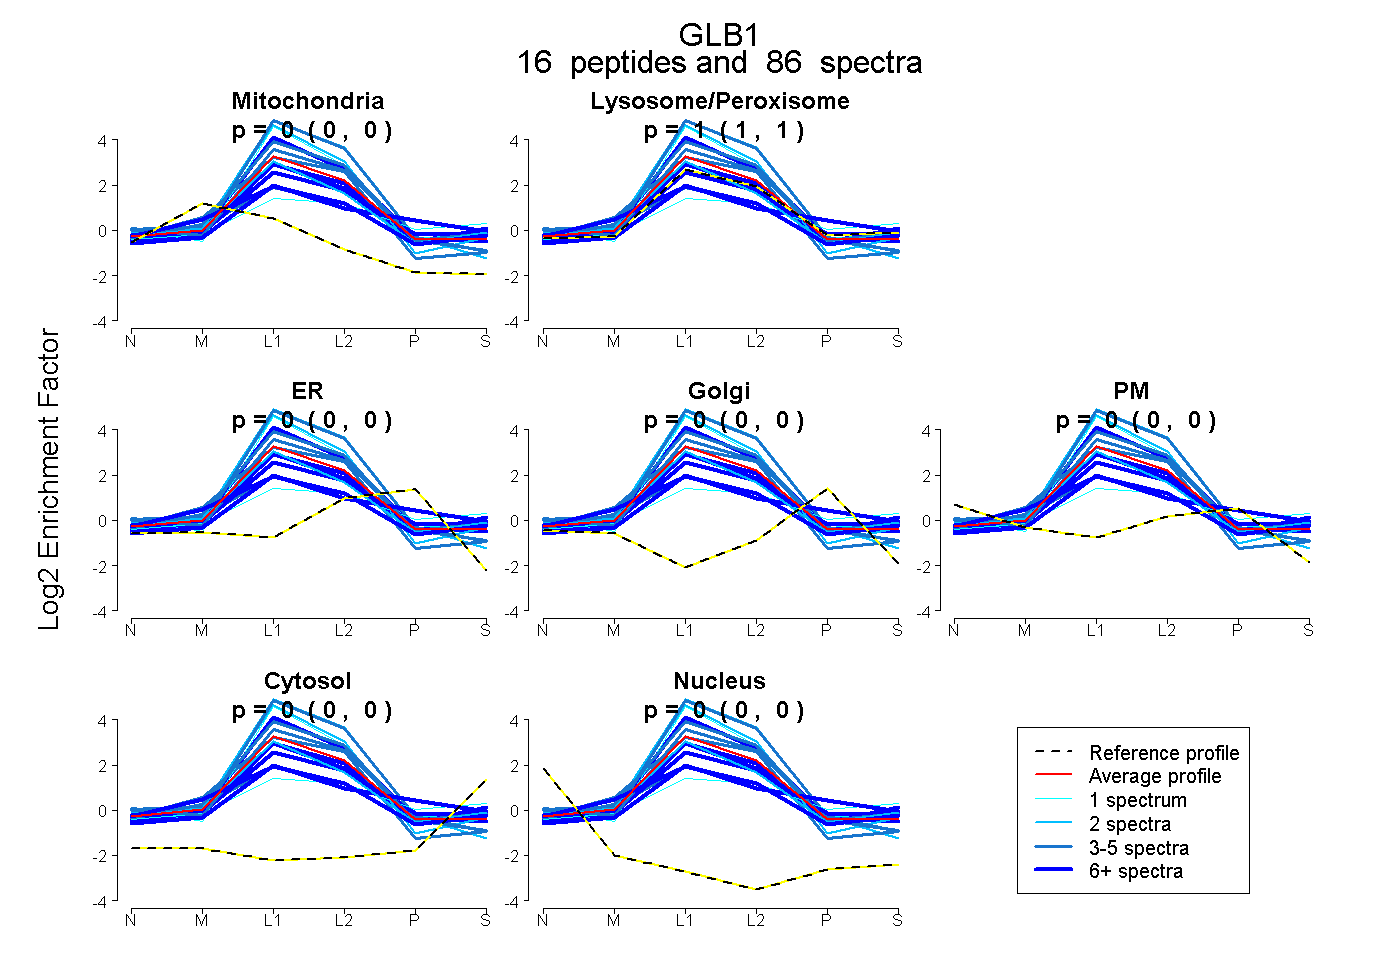 |
0.000 0.000 | 0.000 |
1.000 1.000 | 1.000 |
0.000 0.000 | 0.000 |
0.000 0.000 | 0.000 |
0.000 0.000 | 0.000 |
0.000 0.000 | 0.000 |
0.000 0.000 | 0.000 |
|||
| Plot | Lyso | Other | |||||||||||
| Expt C |
19 peptides |
384 spectra |
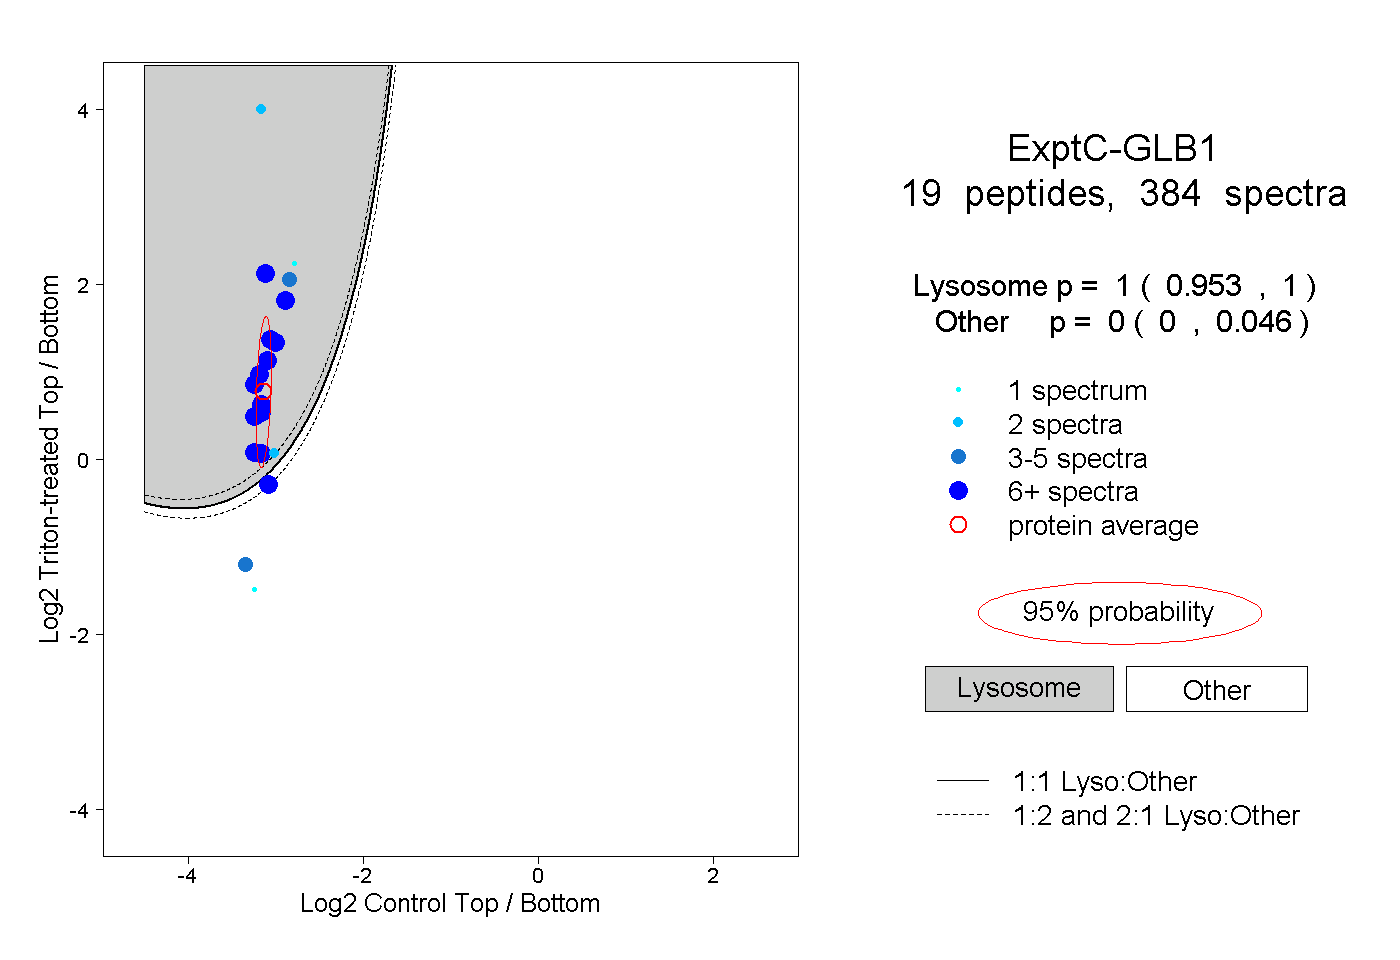 |
1.000 0.953 | 1.000 |
0.000 0.000 | 0.046 |
||||||||
| Plot | Lyso | Other | |||||||||||
| Expt D |
9 peptides |
24 spectra |
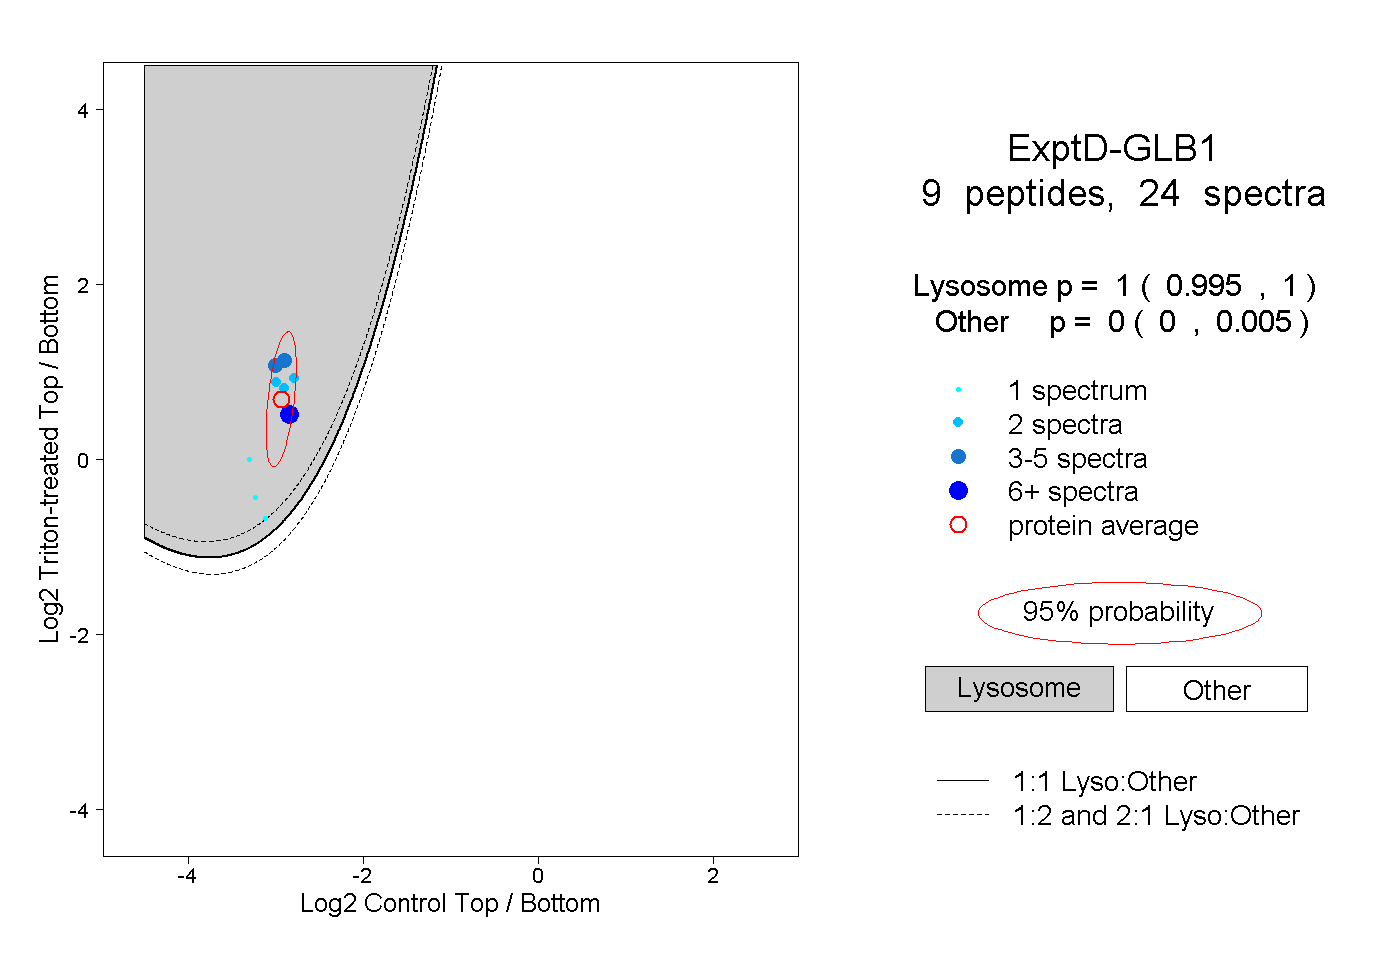 |
1.000 0.995 | 1.000 |
0.000 0.000 | 0.005 |