 15
15peptides
spectra
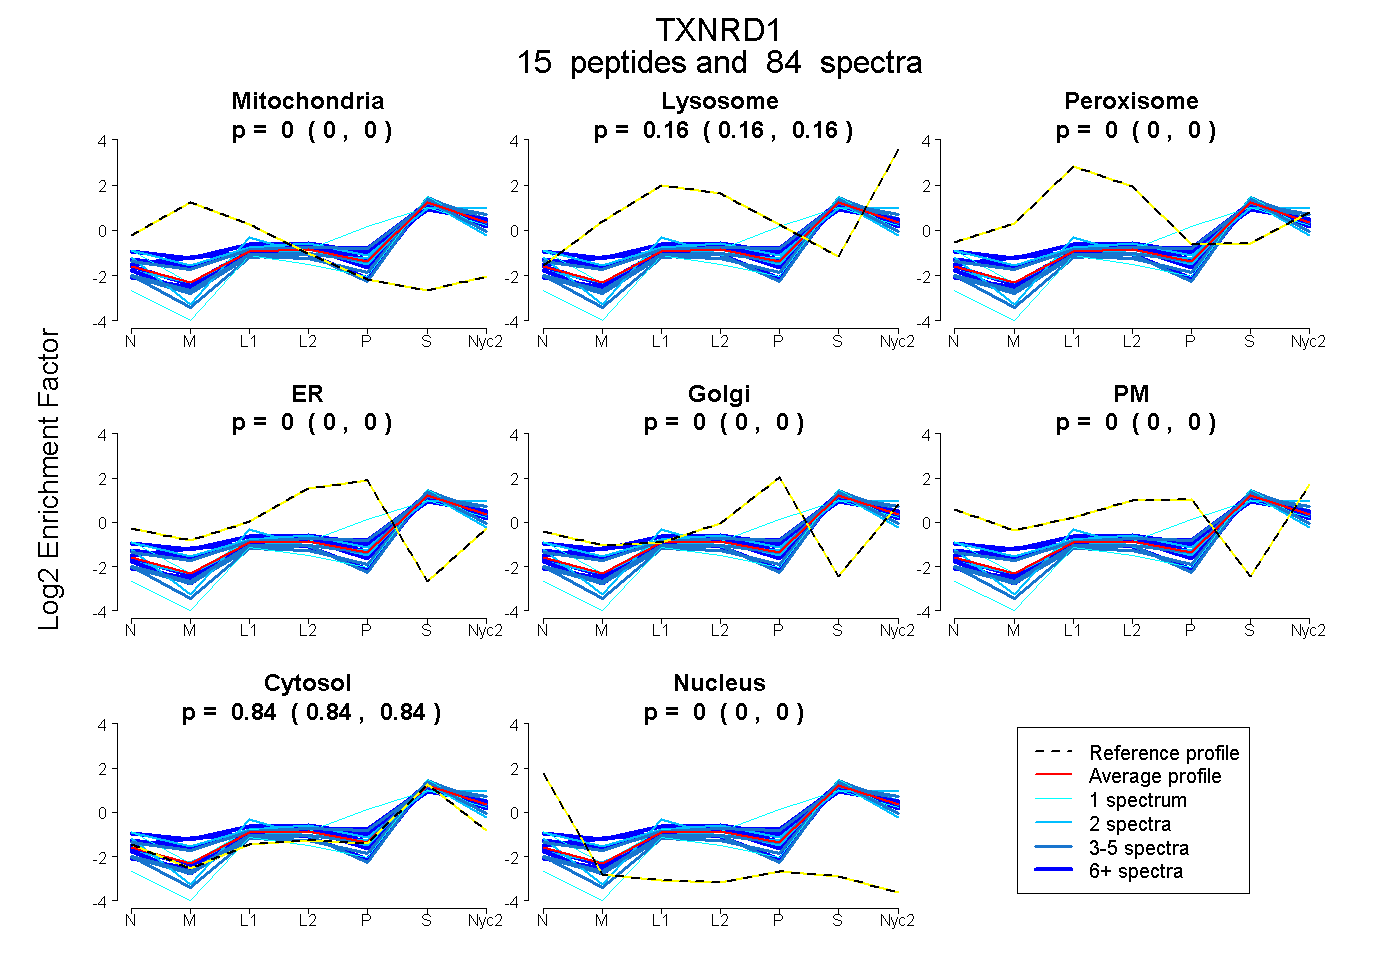
0.000 | 0.000
0.156 | 0.161
0.000 | 0.000
0.000 | 0.000
0.000 | 0.000
0.000 | 0.000
0.839 | 0.844
0.000 | 0.000
6peptides
spectra
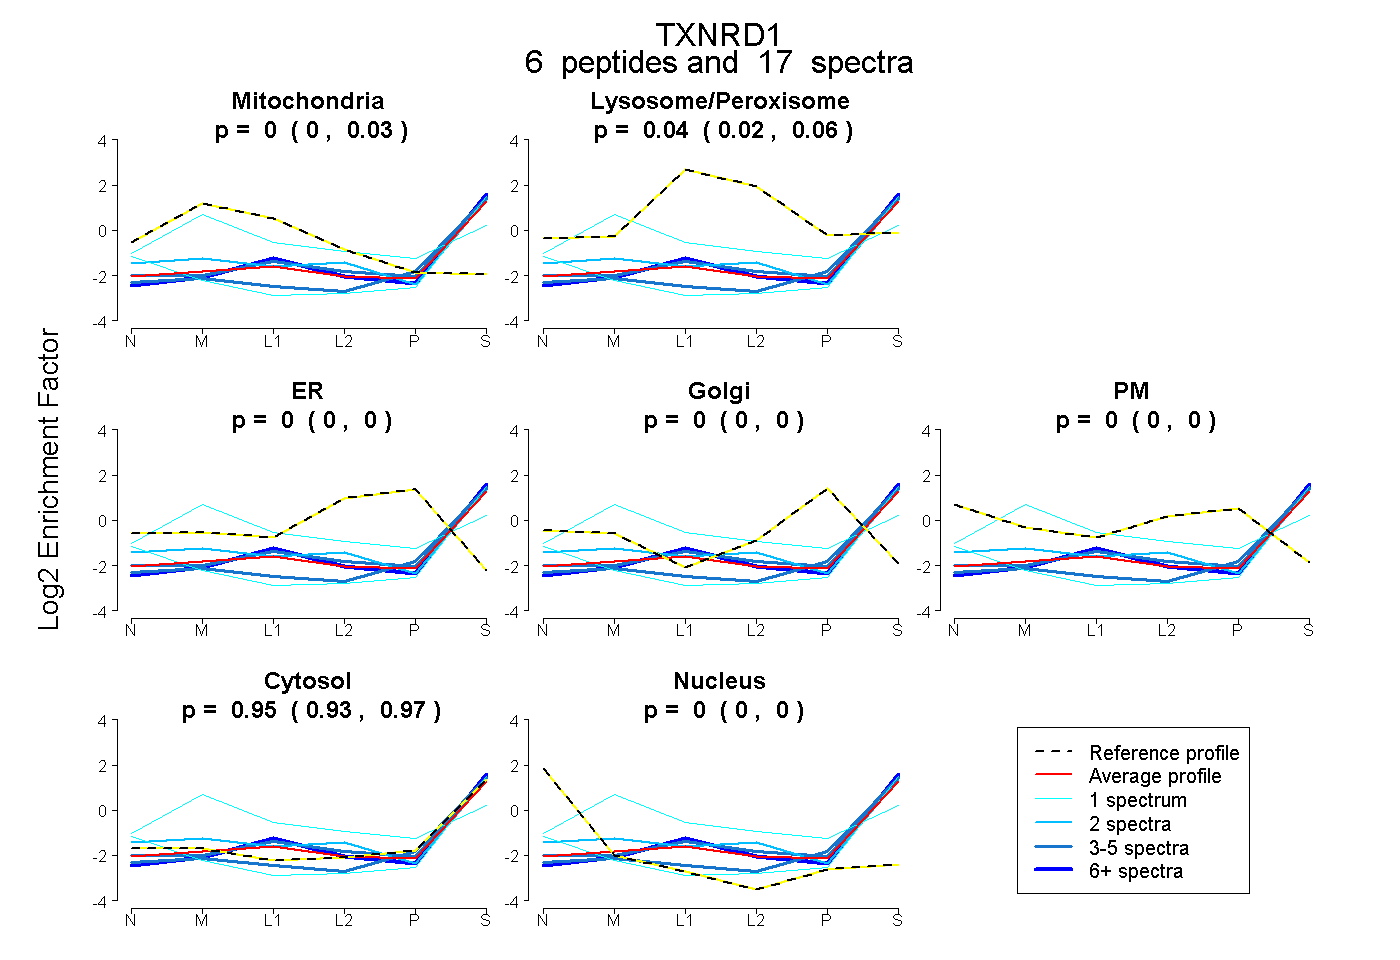
0.000 | 0.027
0.018 | 0.059
0.000 | 0.000
0.000 | 0.000
0.000 | 0.000
0.930 | 0.967
0.000 | 0.000
16peptides
spectra
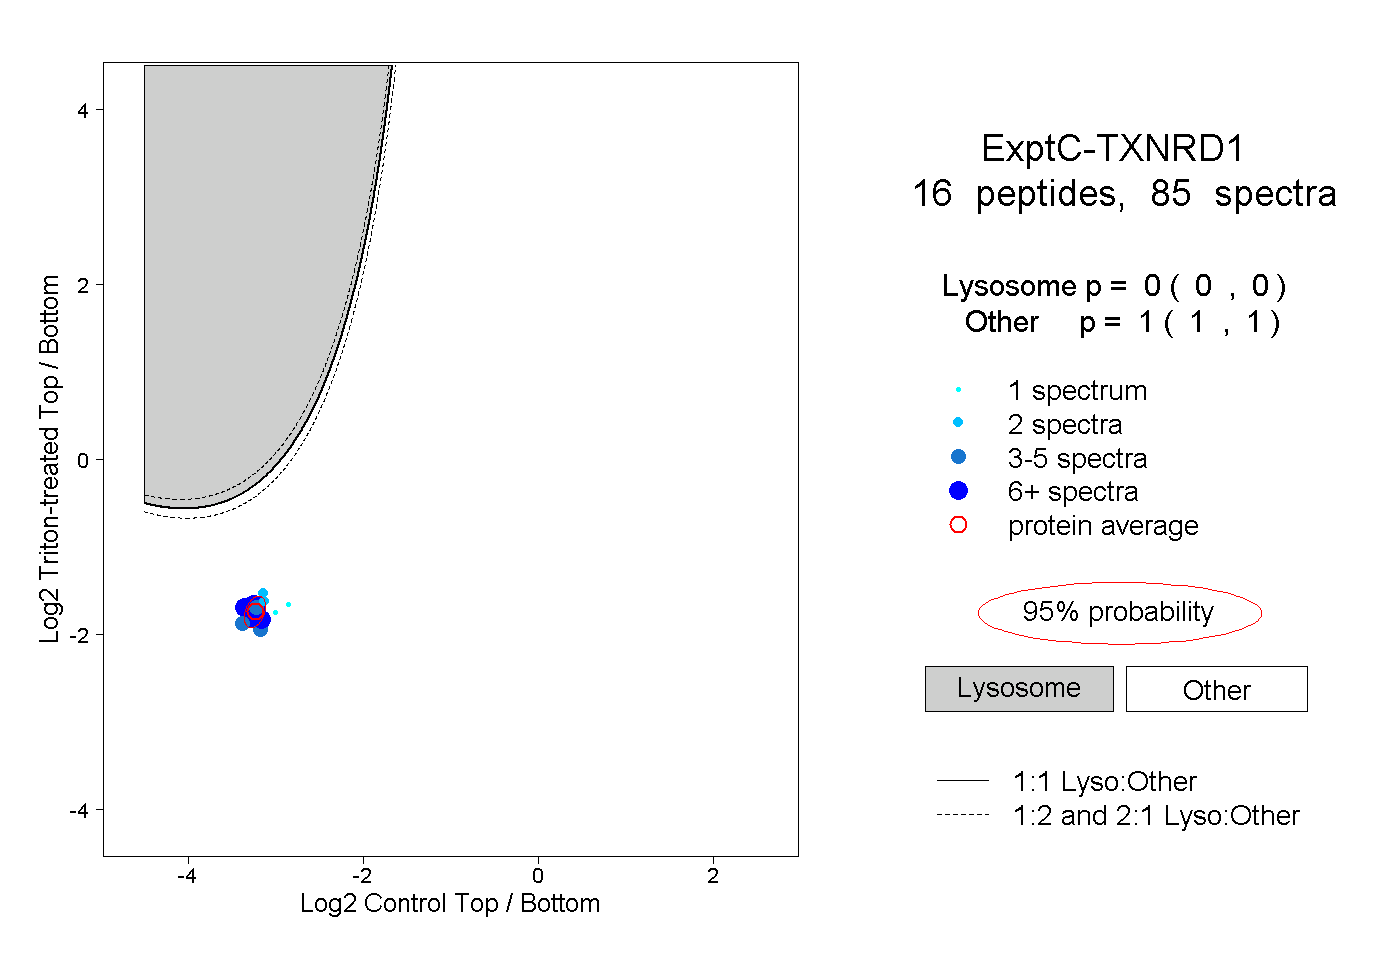
0.000 | 0.000
1.000 | 1.000
4peptides
spectra
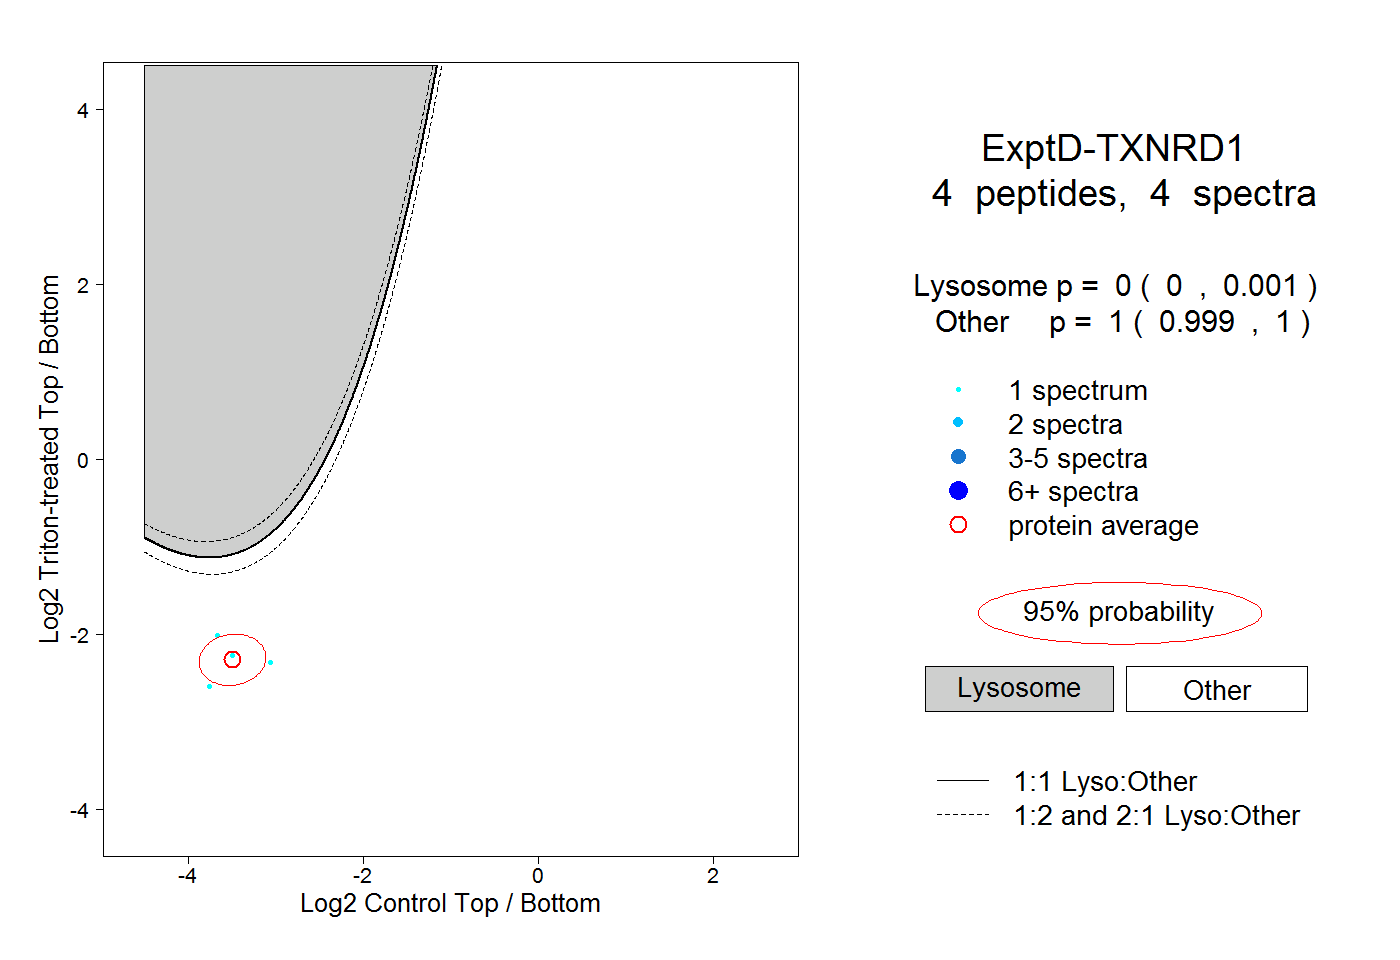
0.000 | 0.001
0.999 | 1.000