 18
18peptides
spectra
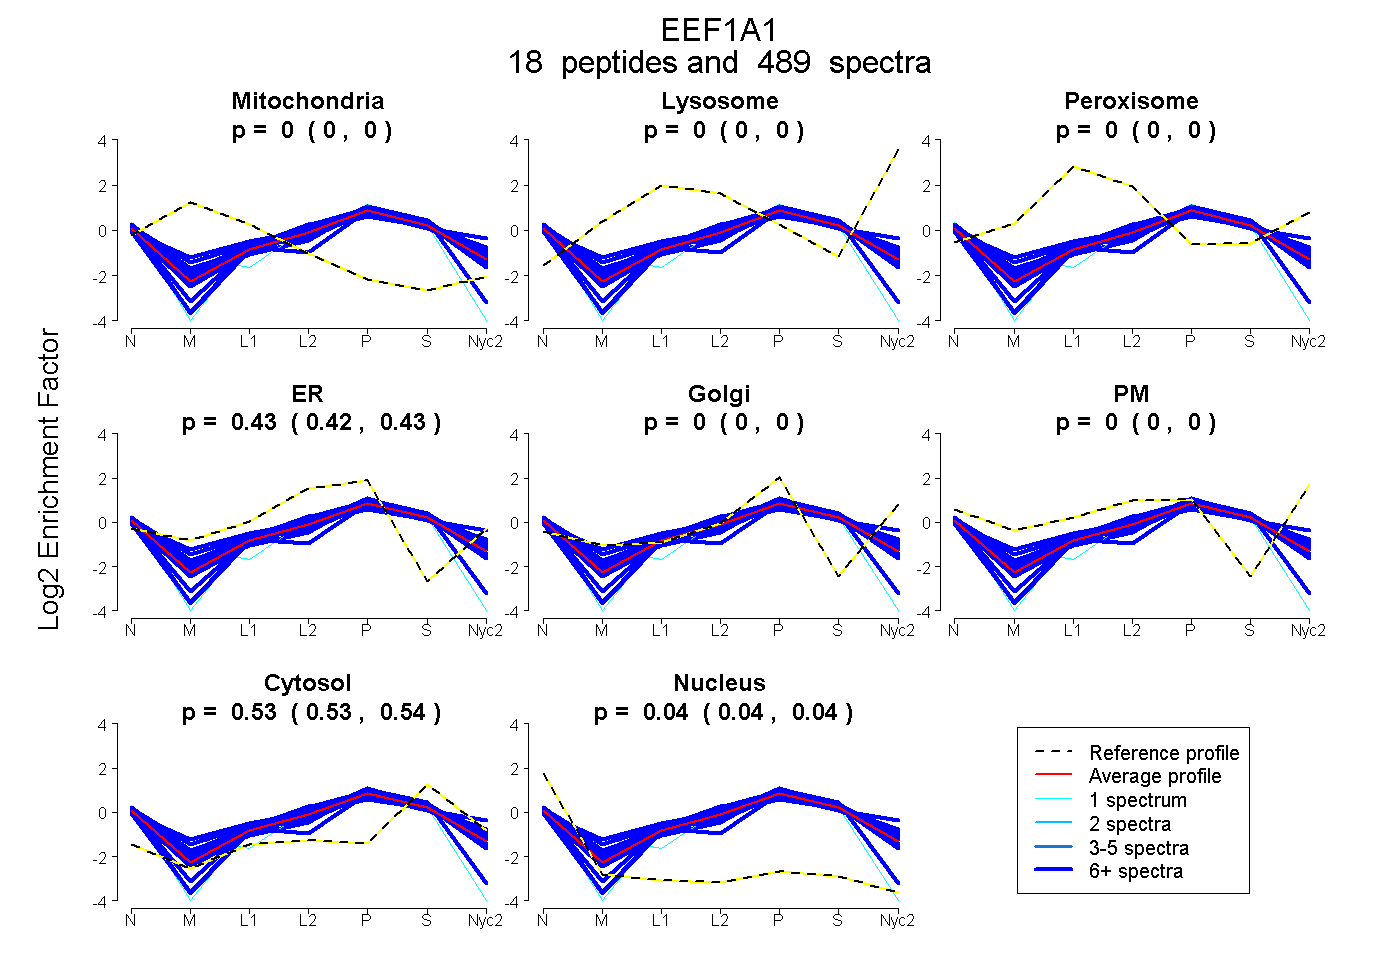
0.000 | 0.000
0.000 | 0.000
0.000 | 0.000
0.424 | 0.426
0.000 | 0.000
0.000 | 0.000
0.534 | 0.535
0.039 | 0.041
16peptides
spectra
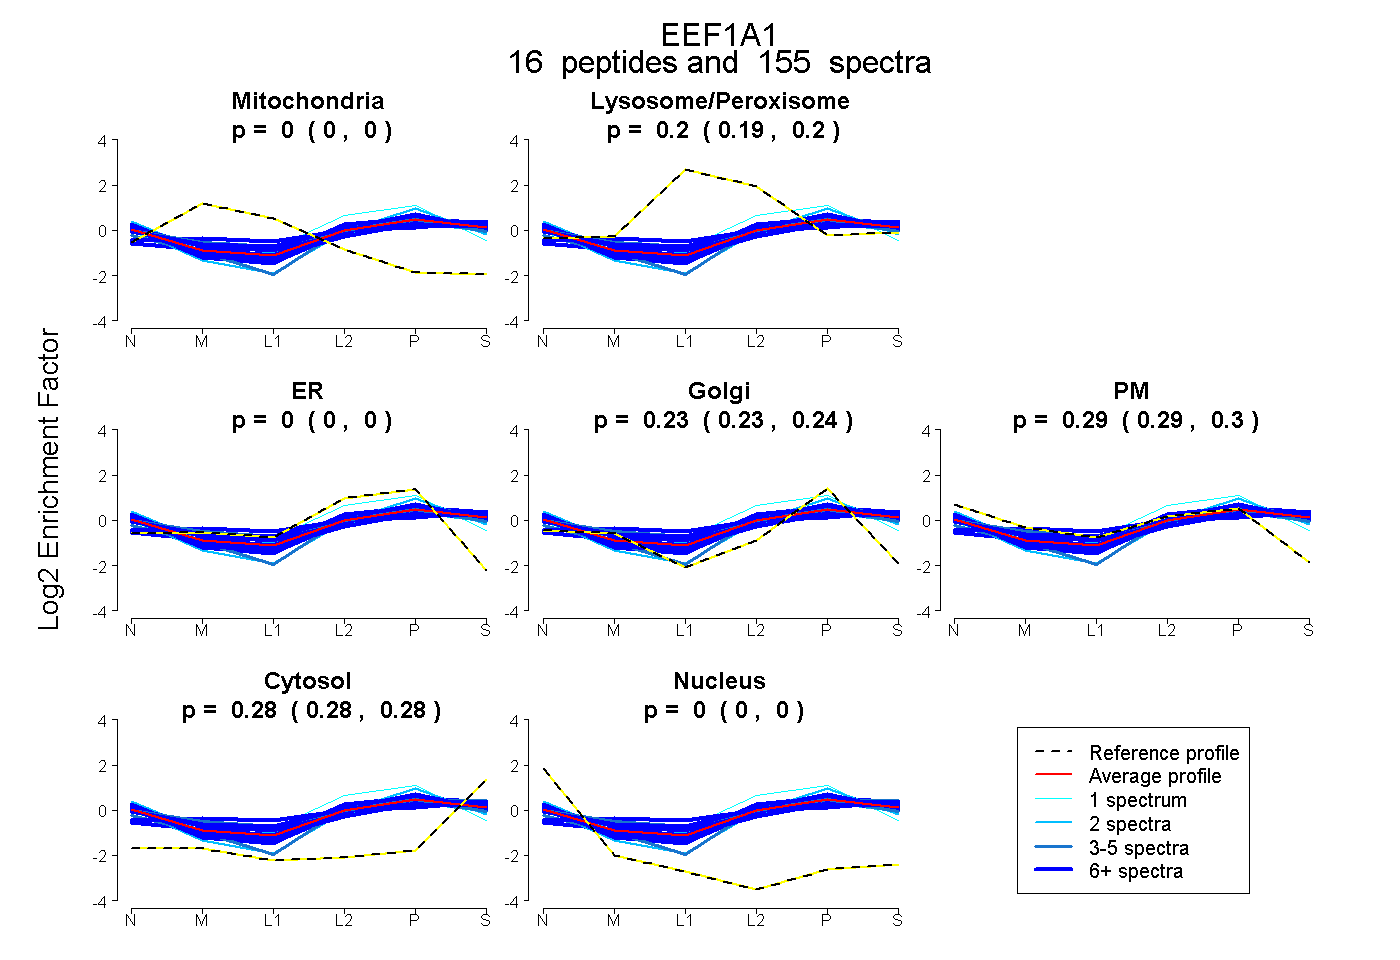
0.000 | 0.000
0.192 | 0.198
0.000 | 0.000
0.225 | 0.237
0.286 | 0.301
0.277 | 0.280
0.000 | 0.000
17peptides
spectra
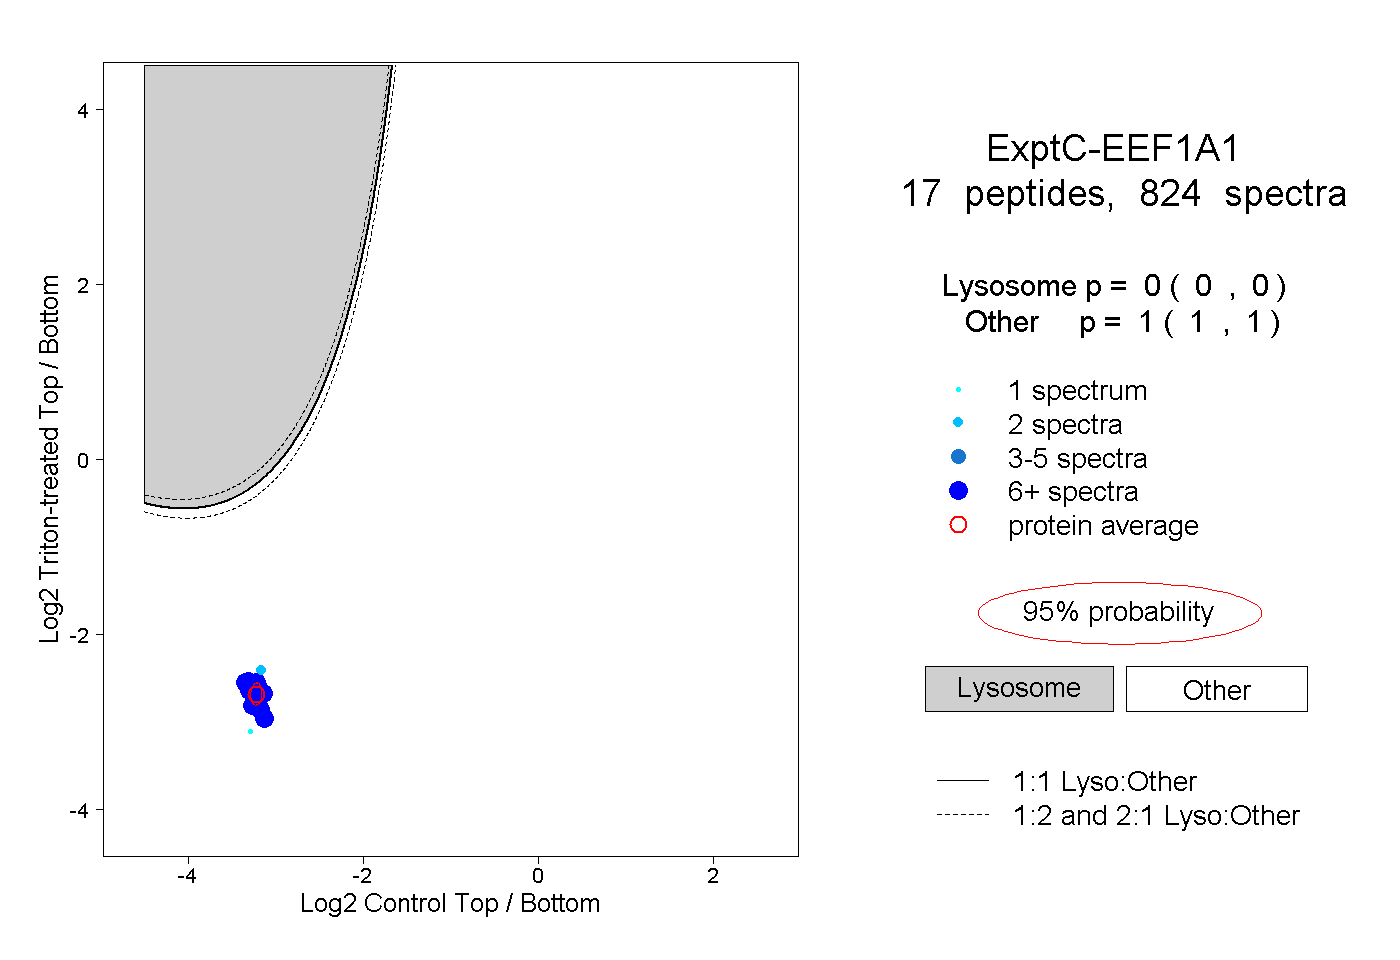
0.000 | 0.000
1.000 | 1.000
12peptides
spectra
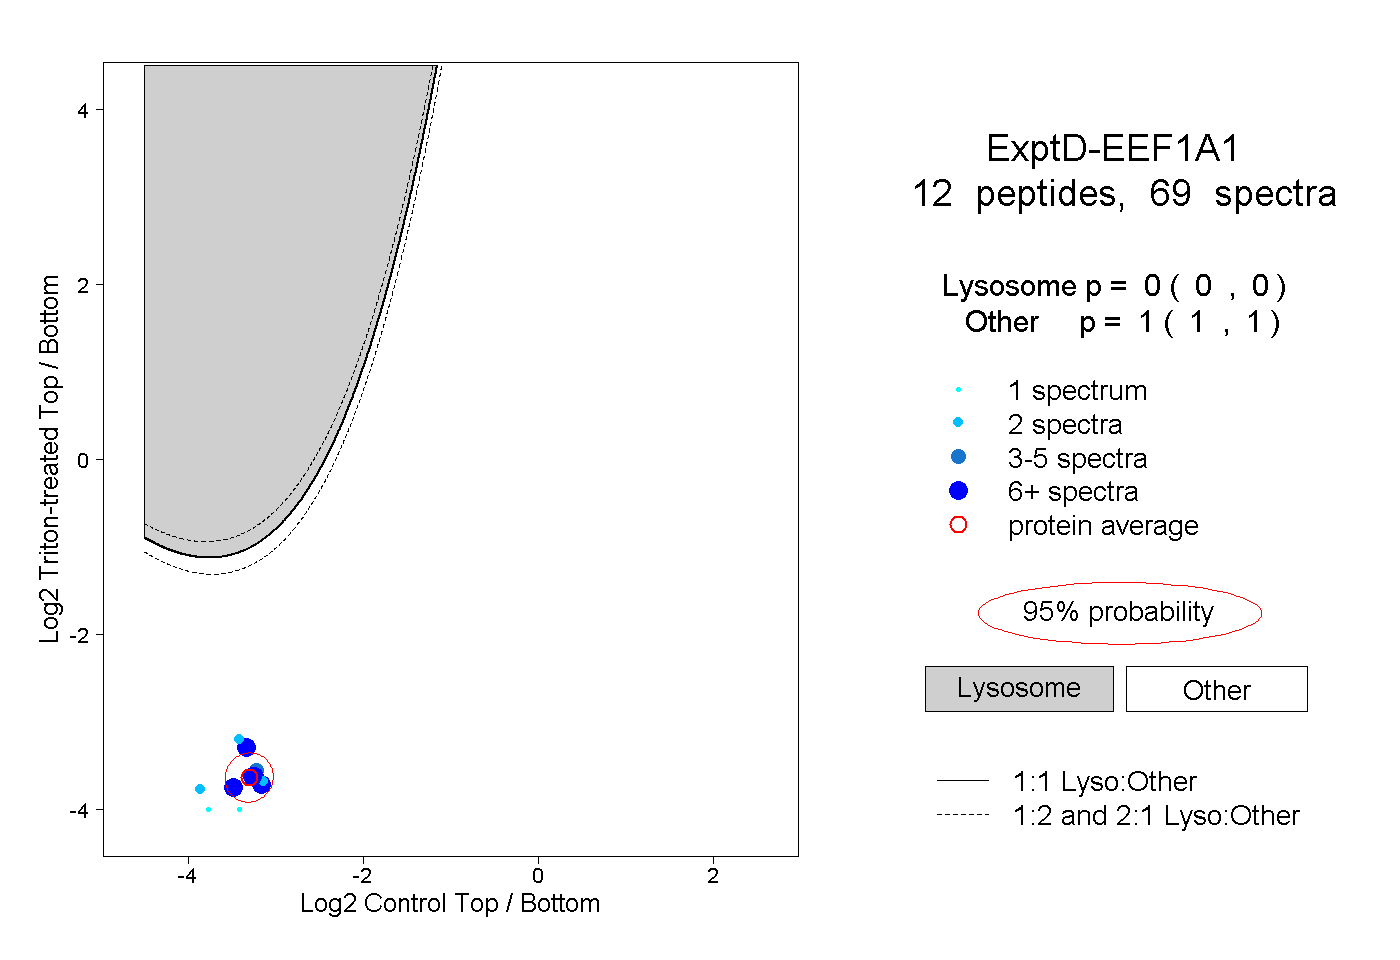
0.000 | 0.000
1.000 | 1.000