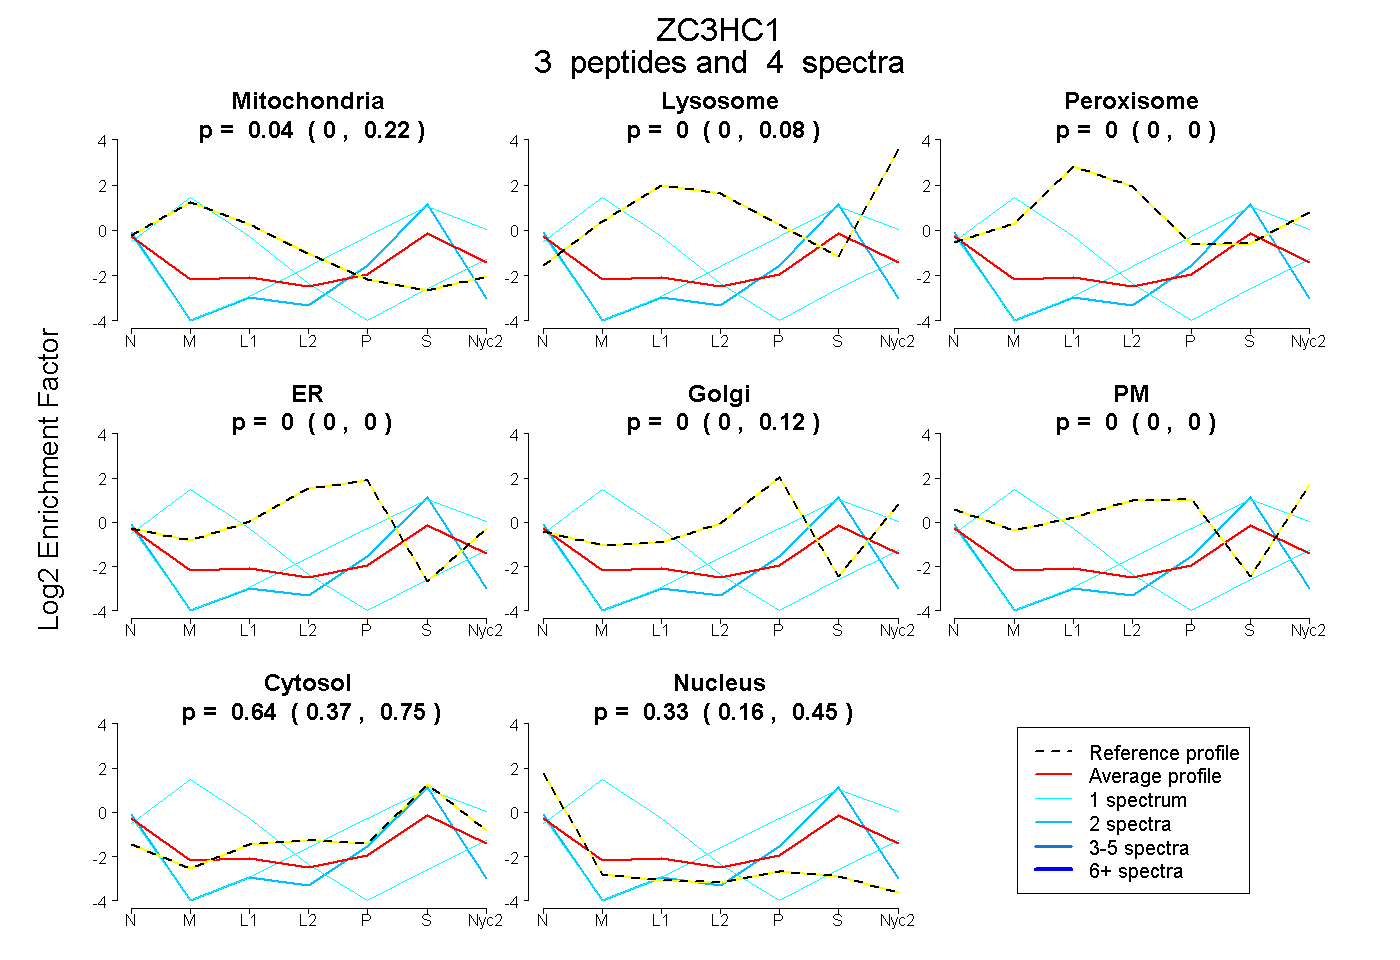
 3
3peptides
spectra
0.000 | 0.219
0.000 | 0.077
0.000 | 0.000
0.000 | 0.000
0.000 | 0.118
0.000 | 0.000
0.365 | 0.751
0.158 | 0.445
| Plot | Mito | Lyso | Perox | ER | Golgi | PM | Cytosol | Nucleus | |||||
| Expt A |
3 peptides |
4 spectra |
|
0.038 0.000 | 0.219 |
0.000 0.000 | 0.077 |
0.000 0.000 | 0.000 |
0.000 0.000 | 0.000 |
0.000 0.000 | 0.118 |
0.000 0.000 | 0.000 |
0.635 0.365 | 0.751 |
0.327 0.158 | 0.445 |
| 1 spectrum, SPGPIVSR | 0.000 | 0.000 | 0.000 | 0.000 | 0.100 | 0.000 | 0.818 | 0.082 | ||
| 2 spectra, AVMAILLAHK | 0.000 | 0.000 | 0.000 | 0.000 | 0.000 | 0.000 | 0.589 | 0.411 | ||
| 1 spectrum, TWGAVVR | 0.928 | 0.000 | 0.000 | 0.000 | 0.000 | 0.000 | 0.000 | 0.072 |