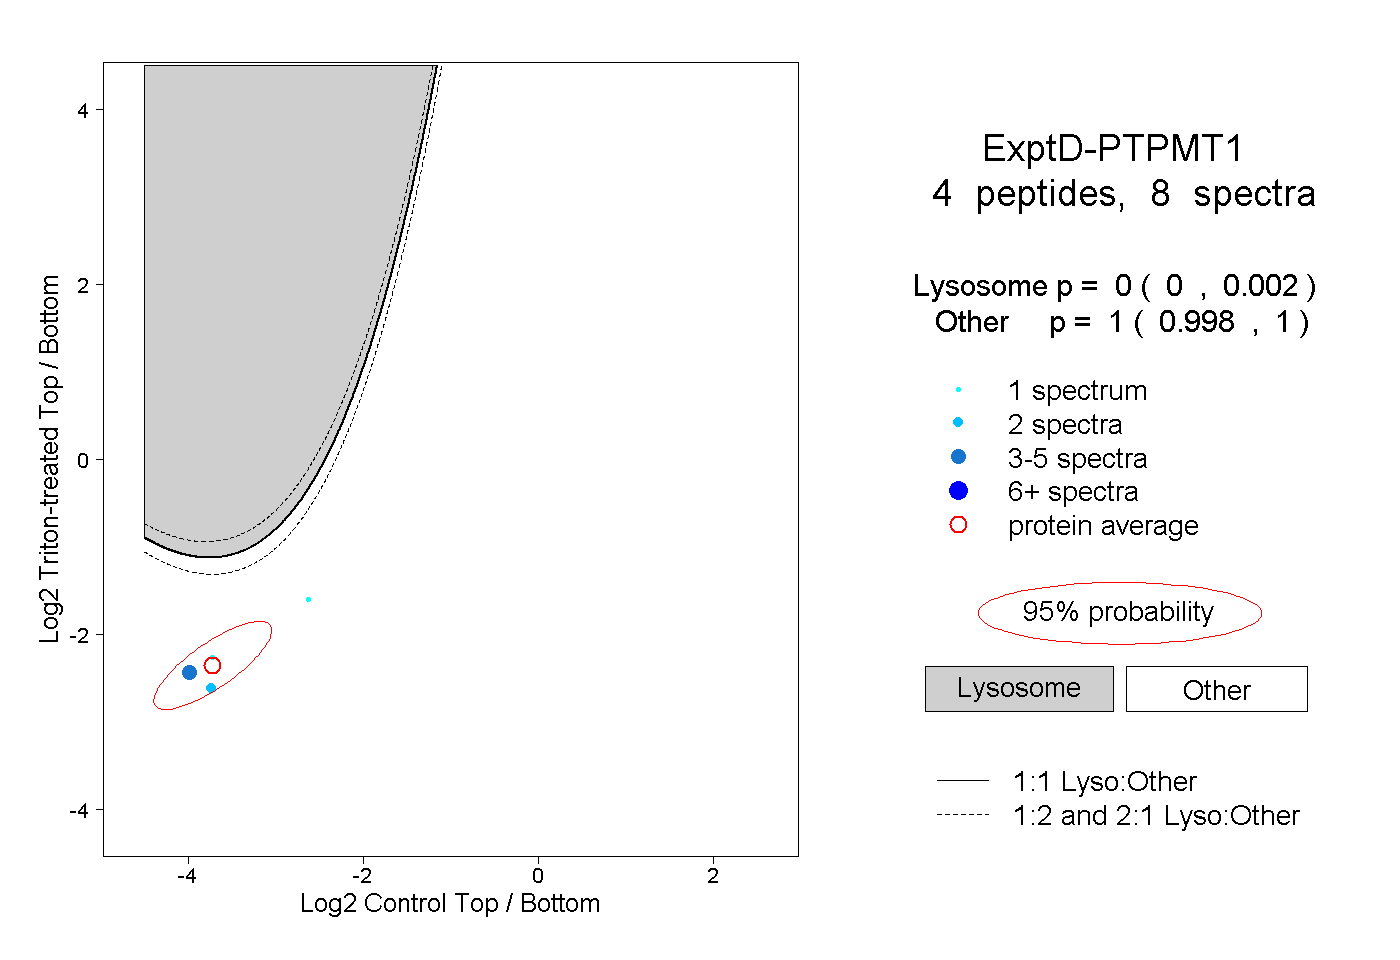
6
6peptides
spectra
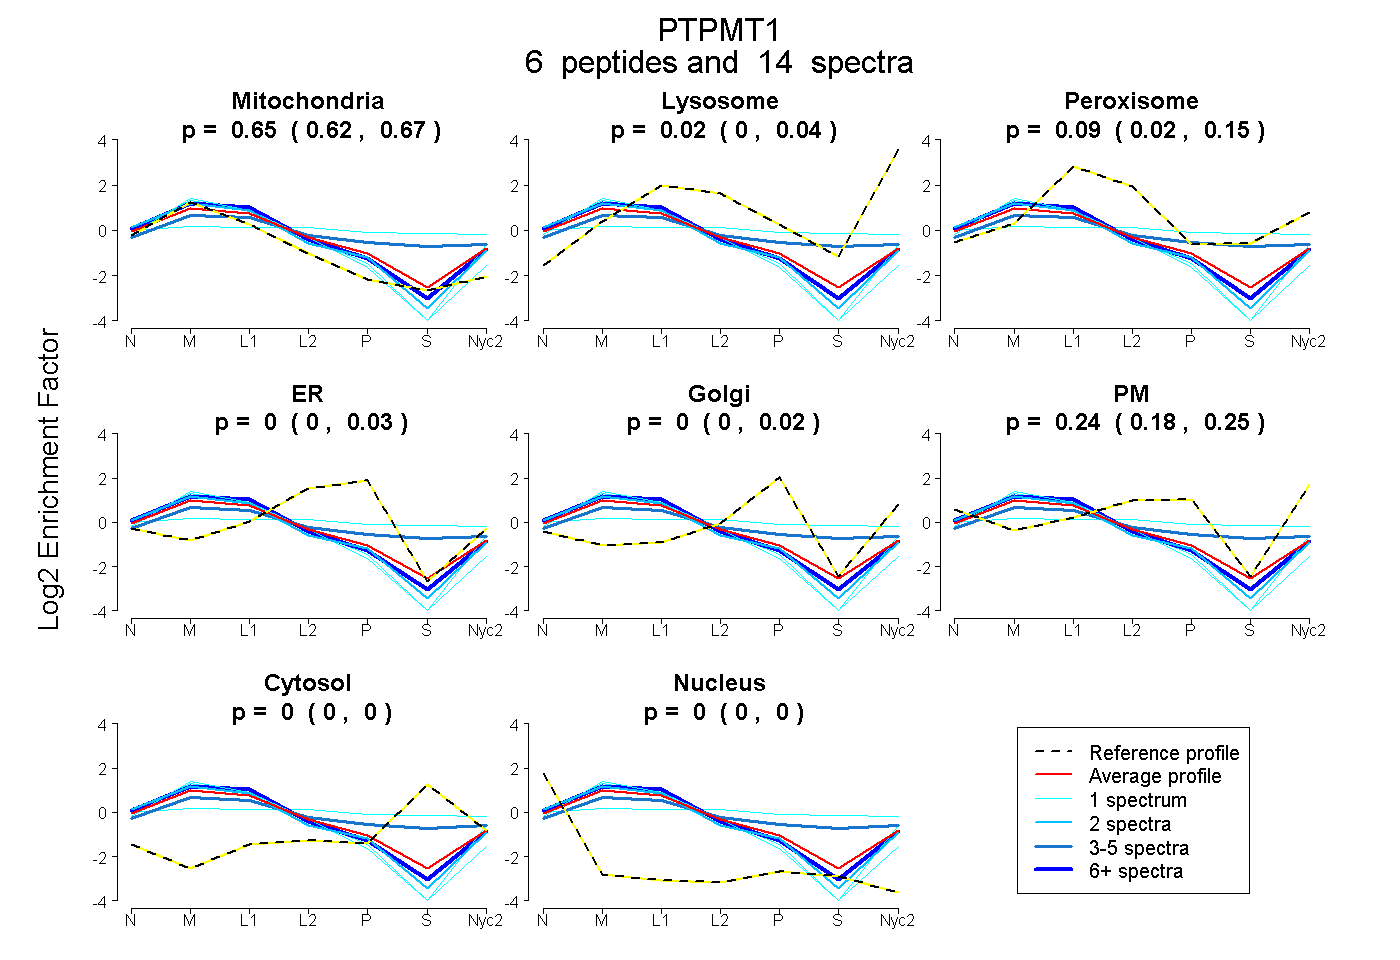
0.624 | 0.673
0.000 | 0.045
0.024 | 0.146
0.000 | 0.030
0.000 | 0.021
0.179 | 0.253
0.000 | 0.000
0.000 | 0.000
3peptides
spectra
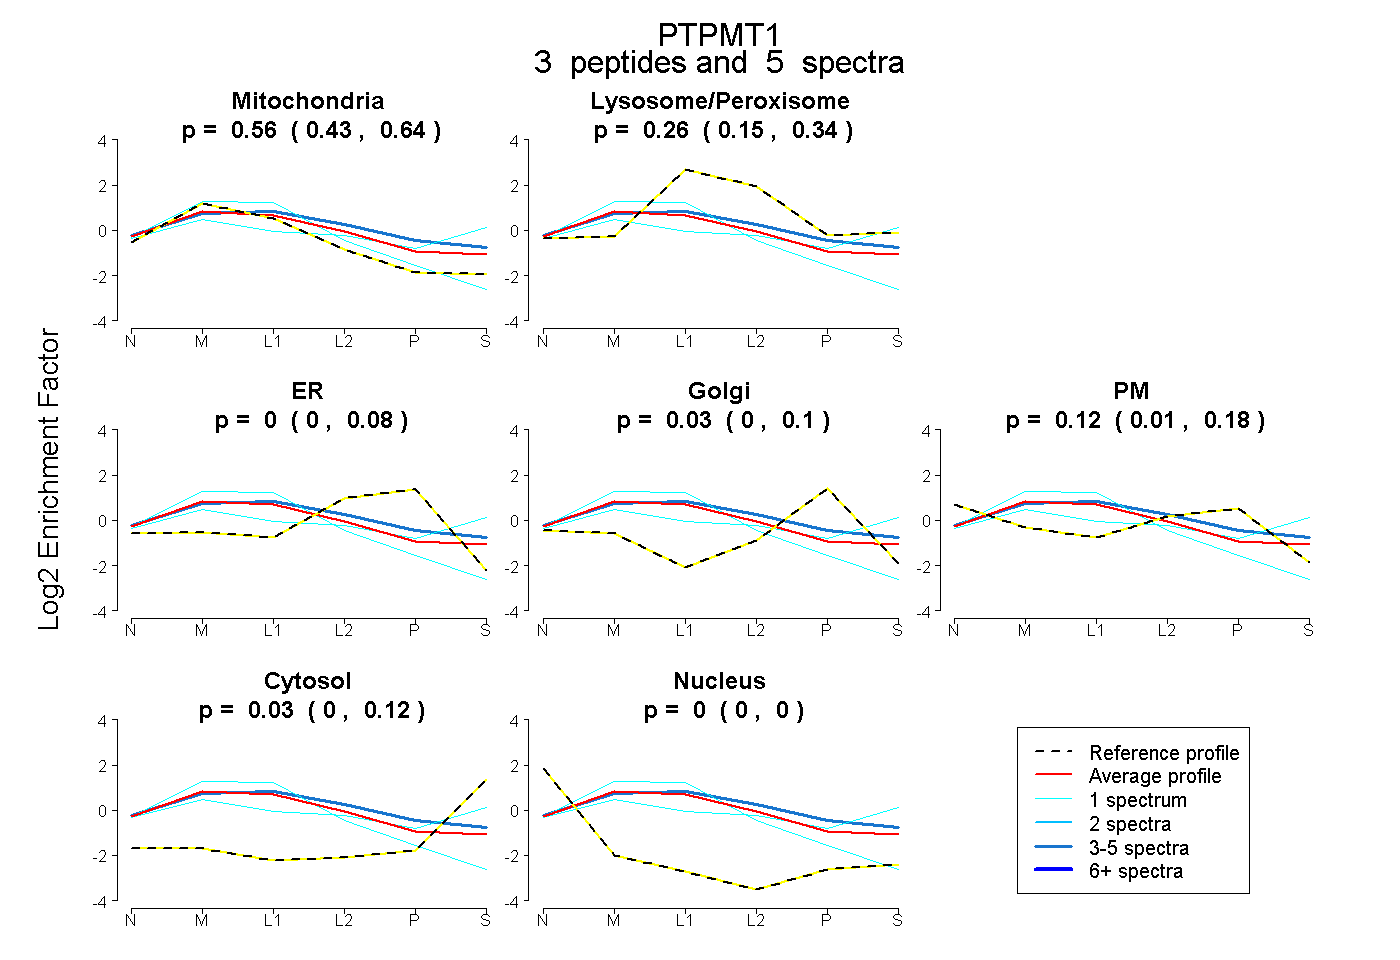
0.430 | 0.637
0.147 | 0.343
0.000 | 0.079
0.000 | 0.105
0.011 | 0.177
0.000 | 0.120
0.000 | 0.000
11peptides
spectra
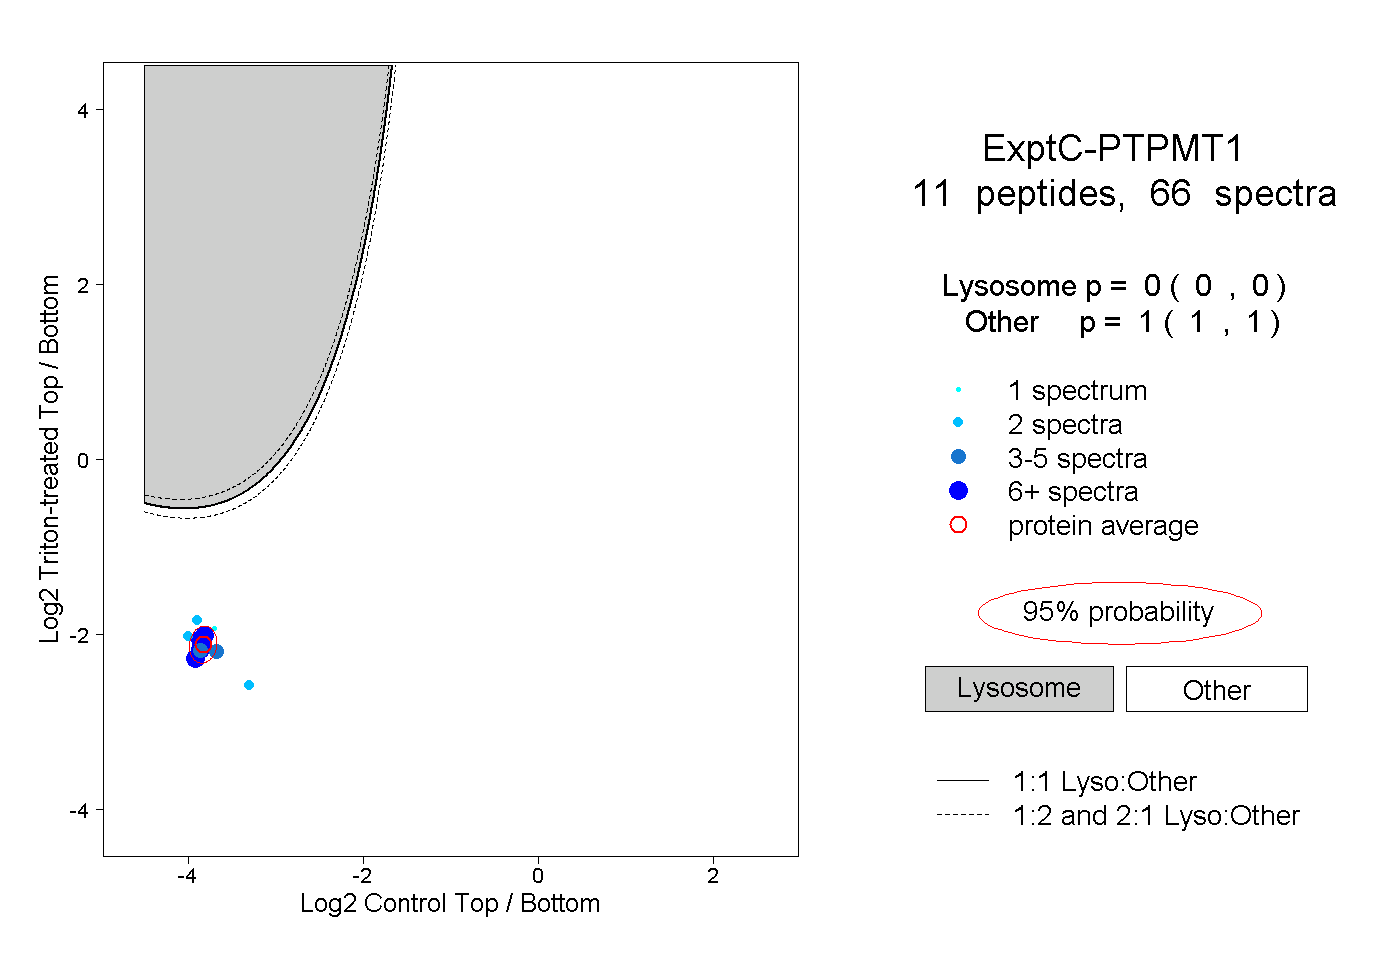
0.000 | 0.000
1.000 | 1.000