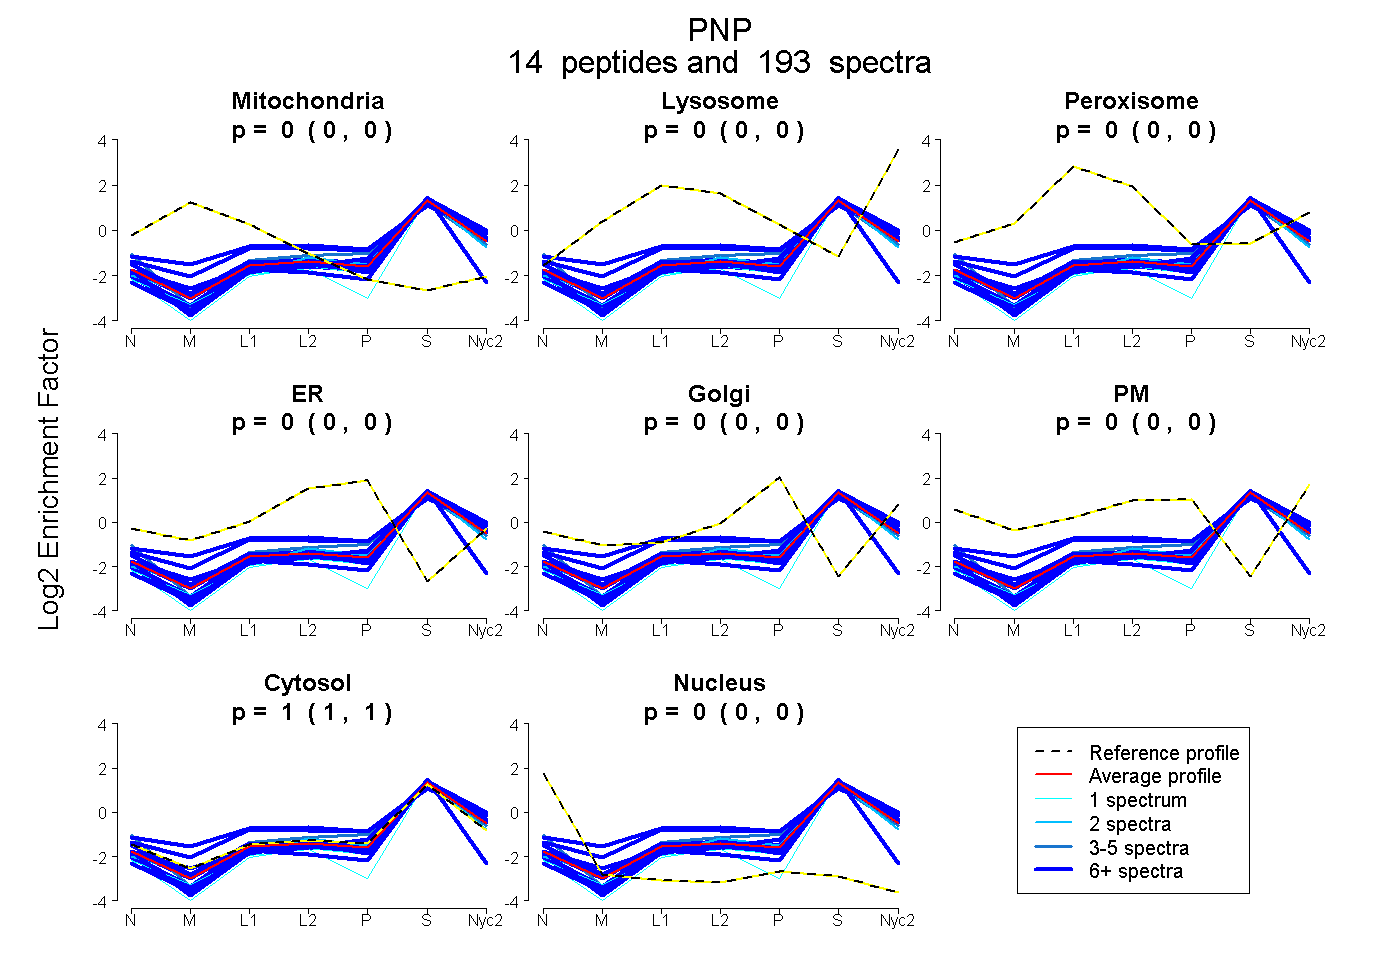
 14
14peptides
spectra
0.000 | 0.000
0.000 | 0.000
0.000 | 0.000
0.000 | 0.000
0.000 | 0.000
0.000 | 0.000
1.000 | 1.000
0.000 | 0.000
| Plot | Mito | Lyso | Perox | ER | Golgi | PM | Cytosol | Nucleus | |||||
| Expt A |
14 peptides |
193 spectra |
|
0.000 0.000 | 0.000 |
0.000 0.000 | 0.000 |
0.000 0.000 | 0.000 |
0.000 0.000 | 0.000 |
0.000 0.000 | 0.000 |
0.000 0.000 | 0.000 |
1.000 1.000 | 1.000 |
0.000 0.000 | 0.000 |
| 6 spectra, TAEWLR | 0.000 | 0.000 | 0.000 | 0.000 | 0.000 | 0.000 | 1.000 | 0.000 | ||
| 2 spectra, HRPQVAVICGSGLGGLTAK | 0.000 | 0.000 | 0.000 | 0.000 | 0.000 | 0.000 | 1.000 | 0.000 | ||
| 13 spectra, VVMDYNNLEK | 0.000 | 0.007 | 0.000 | 0.000 | 0.000 | 0.000 | 0.993 | 0.000 | ||
| 23 spectra, VTFPVR | 0.000 | 0.000 | 0.000 | 0.000 | 0.000 | 0.000 | 1.000 | 0.000 | ||
| 55 spectra, SCVMMQGR | 0.000 | 0.000 | 0.000 | 0.000 | 0.000 | 0.000 | 0.921 | 0.079 | ||
| 8 spectra, DHINLPGFCGQNPLR | 0.000 | 0.107 | 0.106 | 0.000 | 0.015 | 0.003 | 0.769 | 0.000 | ||
| 1 spectrum, QMGEQR | 0.000 | 0.000 | 0.000 | 0.000 | 0.000 | 0.000 | 1.000 | 0.000 | ||
| 12 spectra, AFNAWK | 0.000 | 0.005 | 0.000 | 0.000 | 0.000 | 0.000 | 0.995 | 0.000 | ||
| 7 spectra, FHMYEGYSLSK | 0.000 | 0.165 | 0.003 | 0.000 | 0.000 | 0.000 | 0.833 | 0.000 | ||
| 5 spectra, ASHQEVLEAGK | 0.000 | 0.000 | 0.000 | 0.000 | 0.040 | 0.000 | 0.960 | 0.000 | ||
| 17 spectra, FPAMSDAYDR | 0.000 | 0.000 | 0.000 | 0.000 | 0.000 | 0.000 | 1.000 | 0.000 | ||
| 1 spectrum, MLGADAVGMSTVPEVIVAR | 0.000 | 0.000 | 0.000 | 0.000 | 0.000 | 0.000 | 1.000 | 0.000 | ||
| 14 spectra, VFGFSLITNK | 0.000 | 0.000 | 0.000 | 0.000 | 0.000 | 0.000 | 1.000 | 0.000 | ||
| 29 spectra, FEVGDIMLIR | 0.000 | 0.000 | 0.000 | 0.000 | 0.000 | 0.000 | 1.000 | 0.000 |
| Plot | Mito | Lyso or Perox | ER | Golgi | PM | Cytosol | Nucleus | ||||||
| Expt B |
12 peptides |
58 spectra |
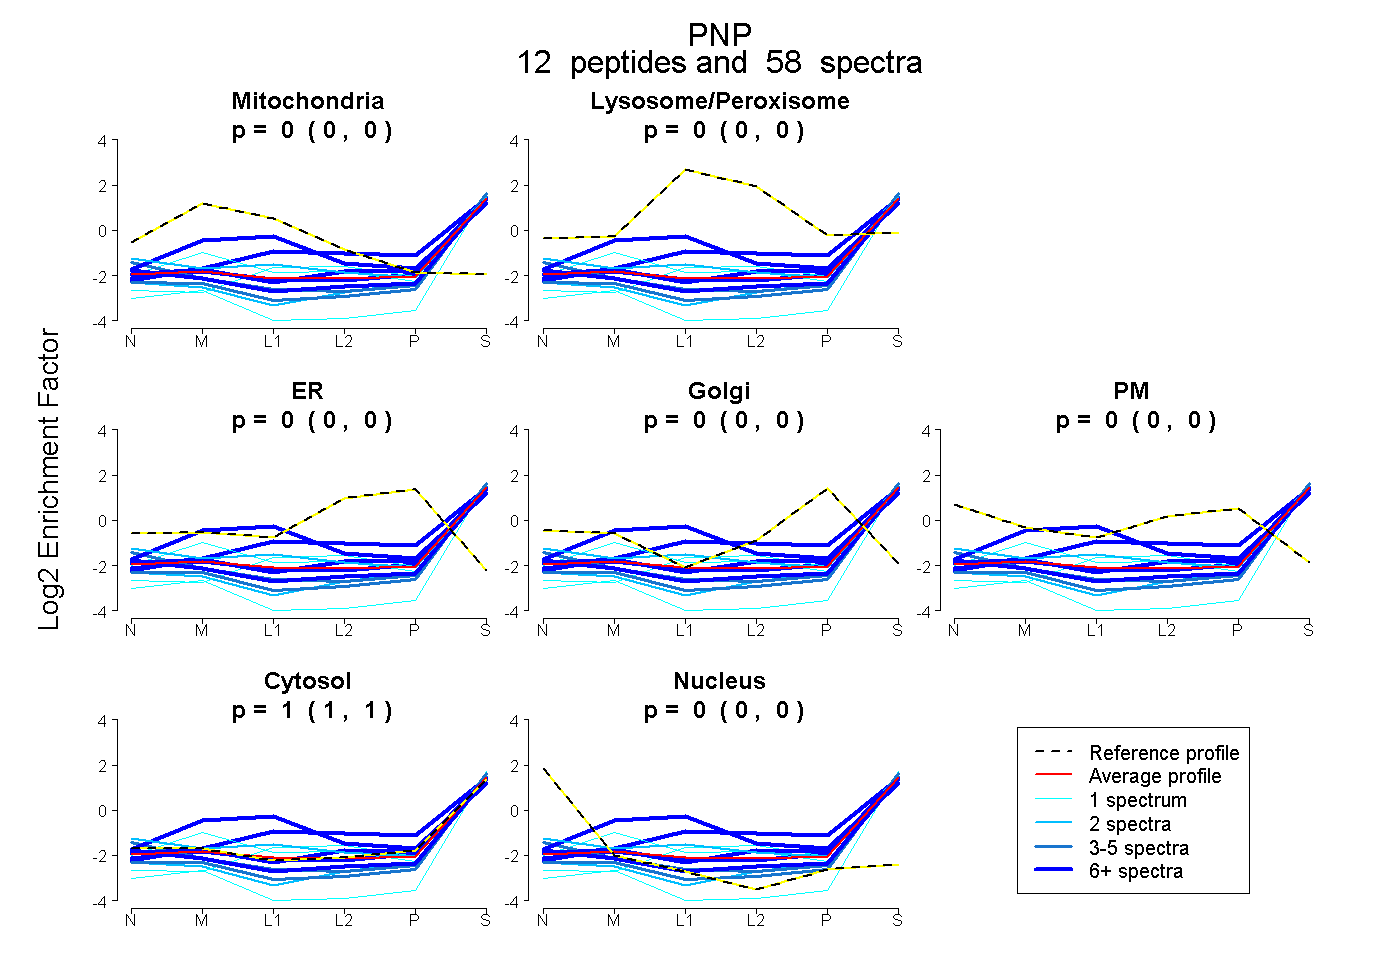 |
0.000 0.000 | 0.000 |
0.000 0.000 | 0.000 |
0.000 0.000 | 0.000 |
0.000 0.000 | 0.000 |
0.000 0.000 | 0.000 |
1.000 1.000 | 1.000 |
0.000 0.000 | 0.000 |
|||
| Plot | Lyso | Other | |||||||||||
| Expt C |
15 peptides |
164 spectra |
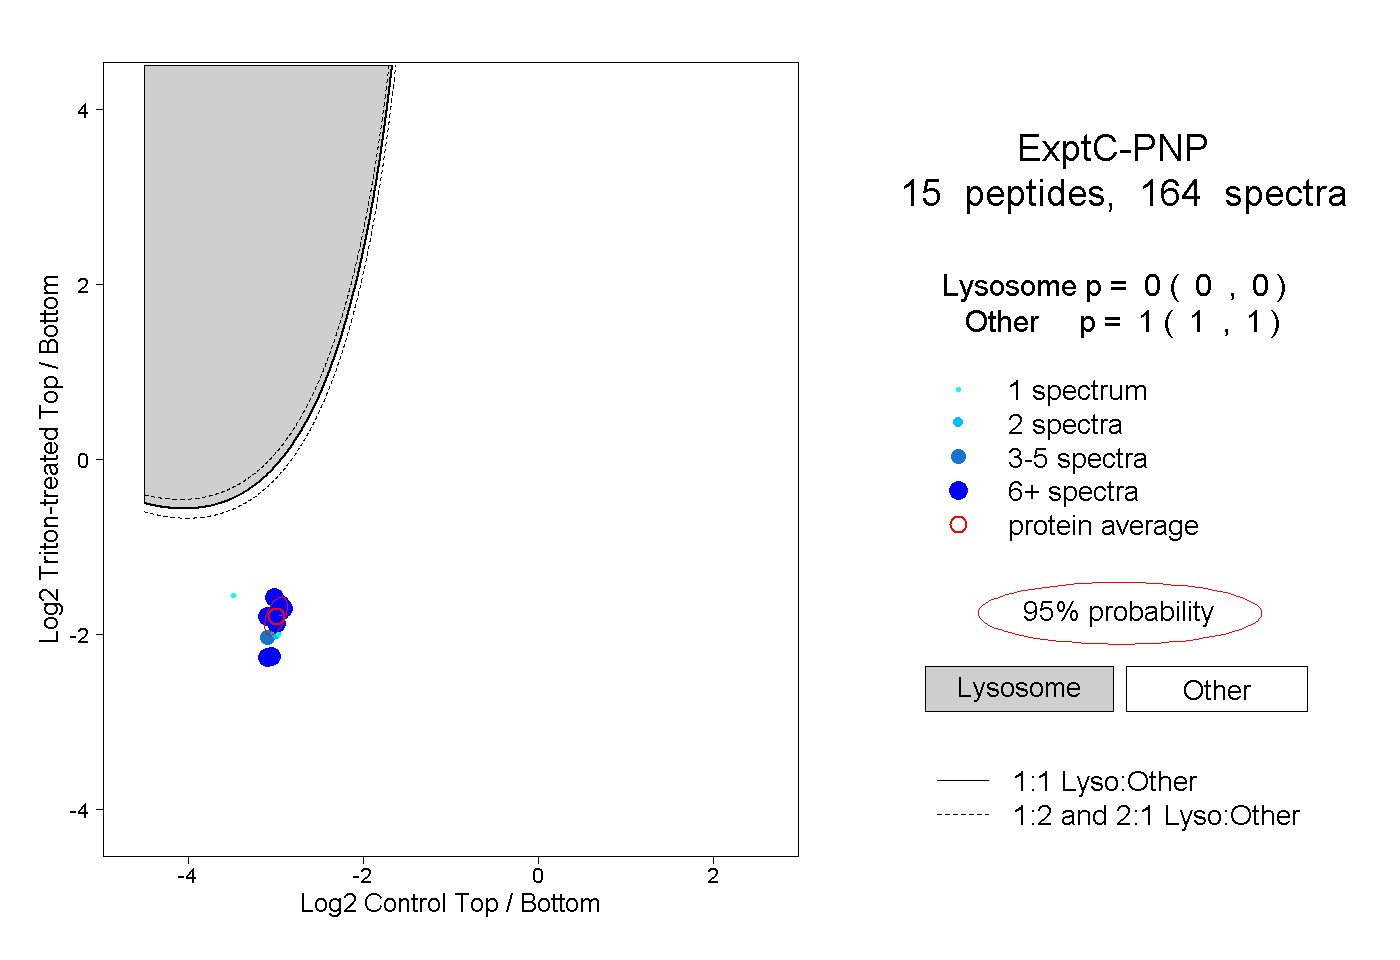 |
0.000 0.000 | 0.000 |
1.000 1.000 | 1.000 |
||||||||
| Plot | Lyso | Other | |||||||||||
| Expt D |
6 peptides |
14 spectra |
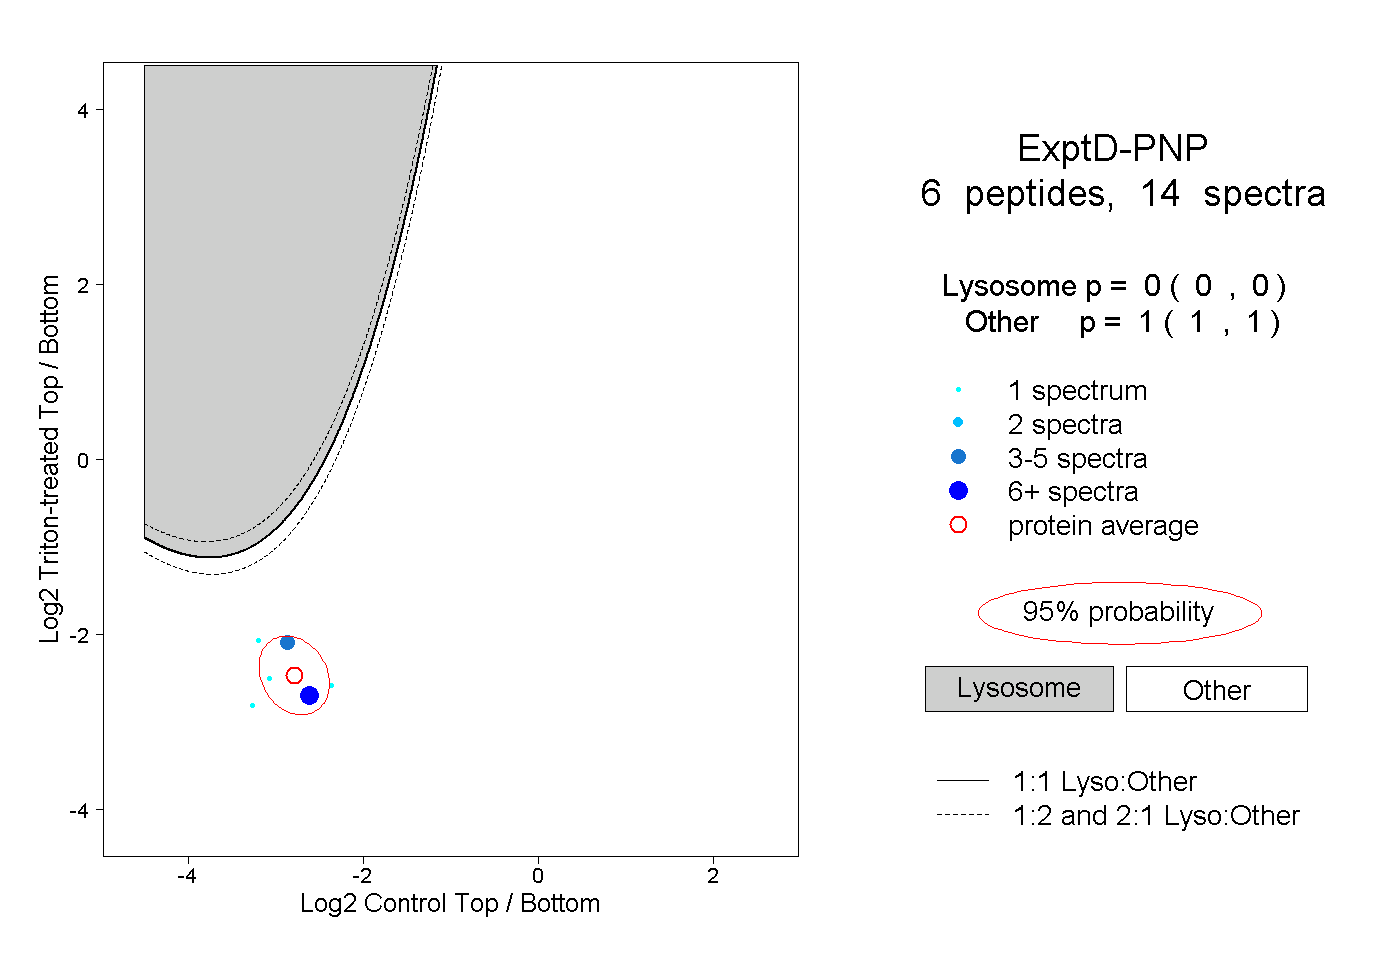 |
0.000 0.000 | 0.000 |
1.000 1.000 | 1.000 |