 7
7peptides
spectra
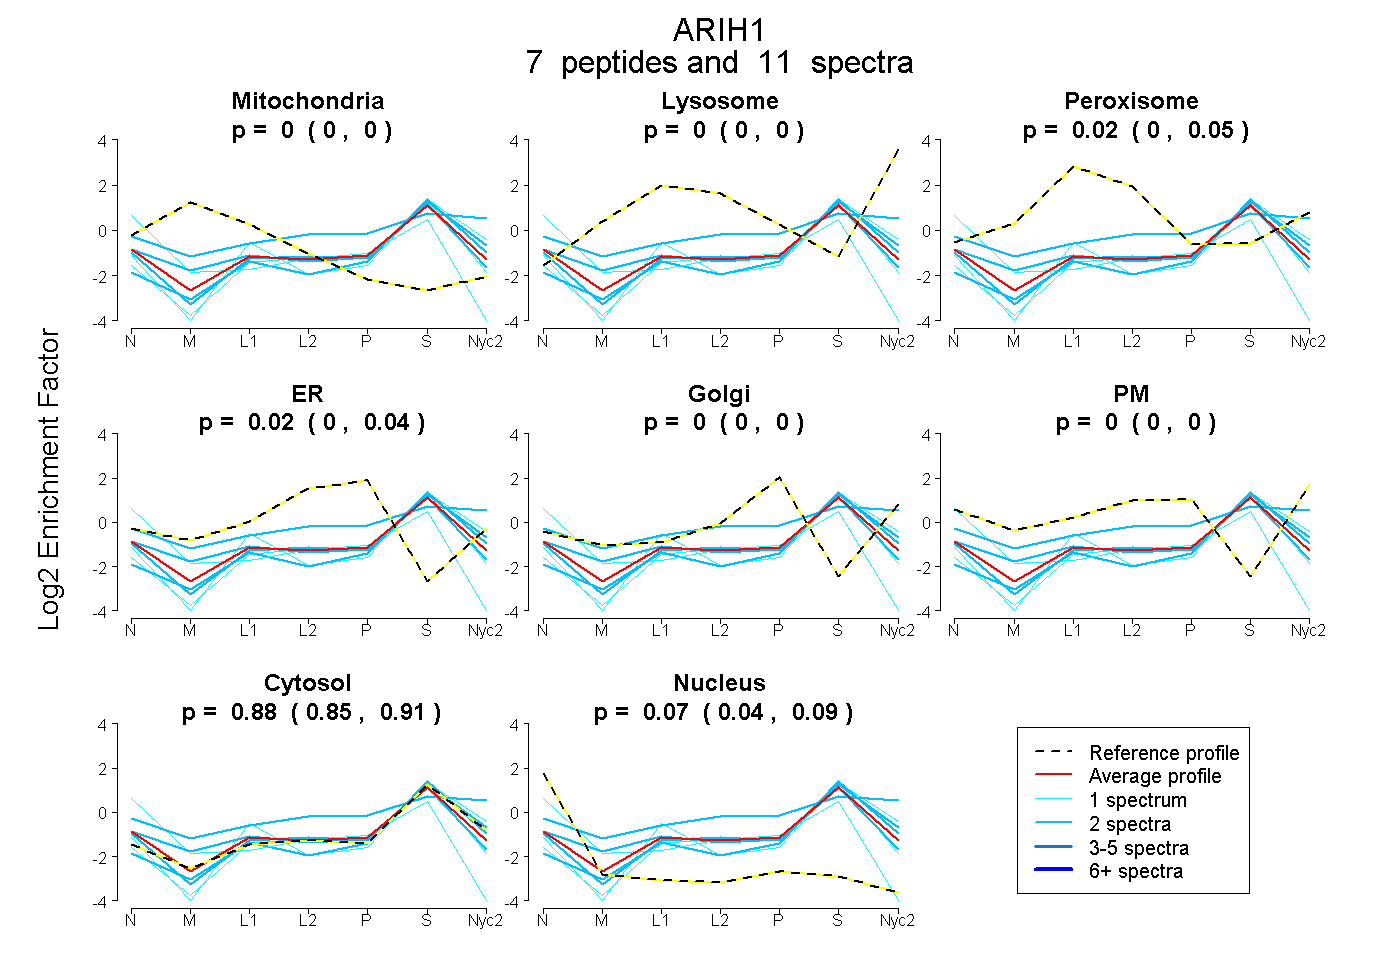
0.000 | 0.000
0.000 | 0.000
0.000 | 0.051
0.000 | 0.043
0.000 | 0.000
0.000 | 0.000
0.850 | 0.912
0.042 | 0.092
1peptide
spectrum
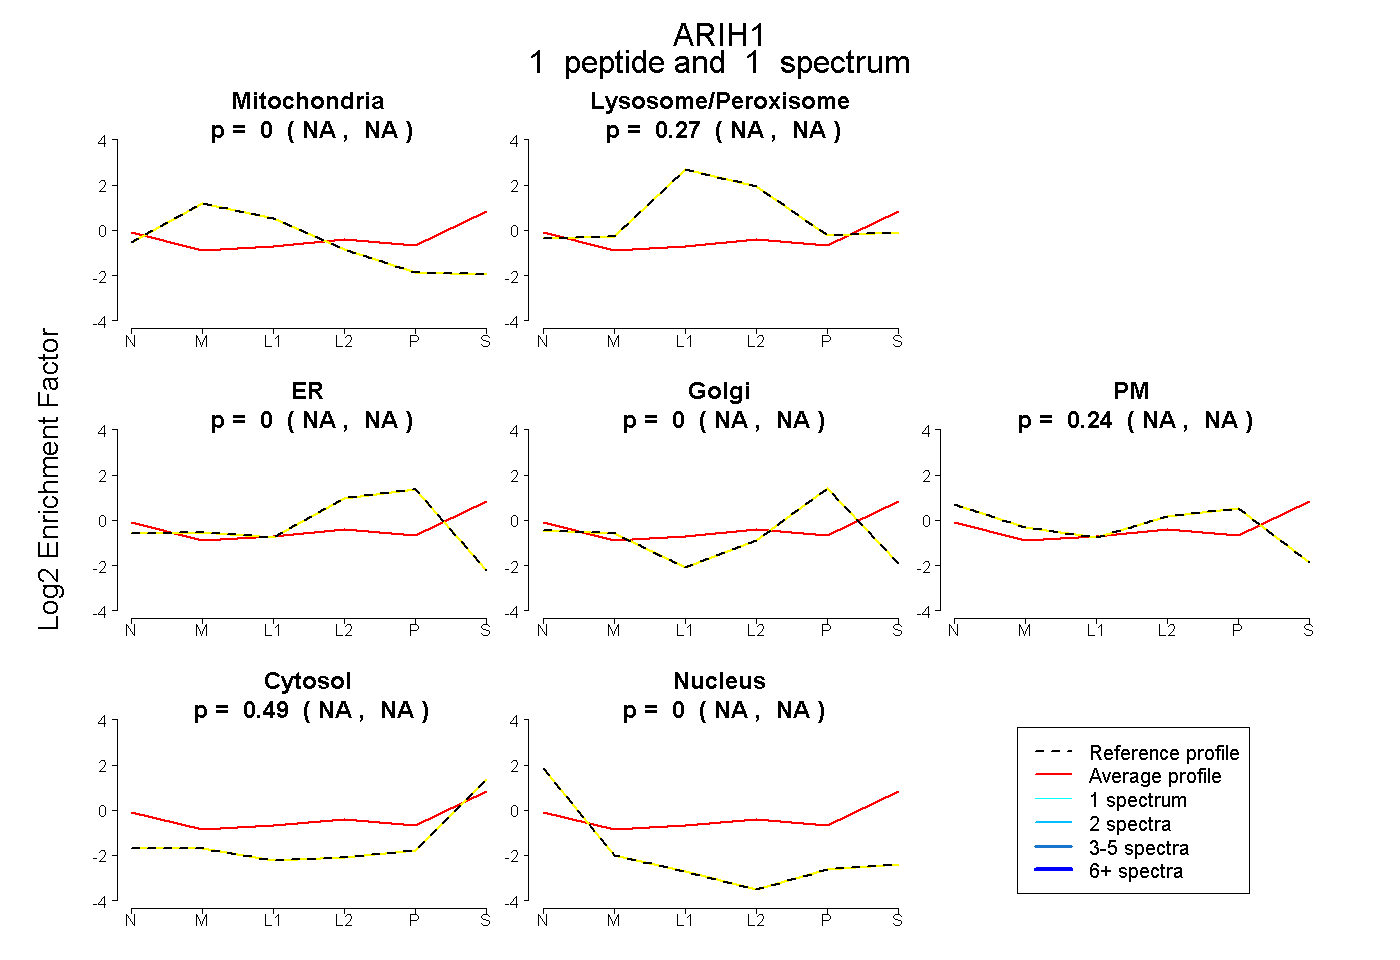
NA | NA
NA | NA
NA | NA
NA | NA
NA | NA
NA | NA
NA | NA
4peptides
spectra
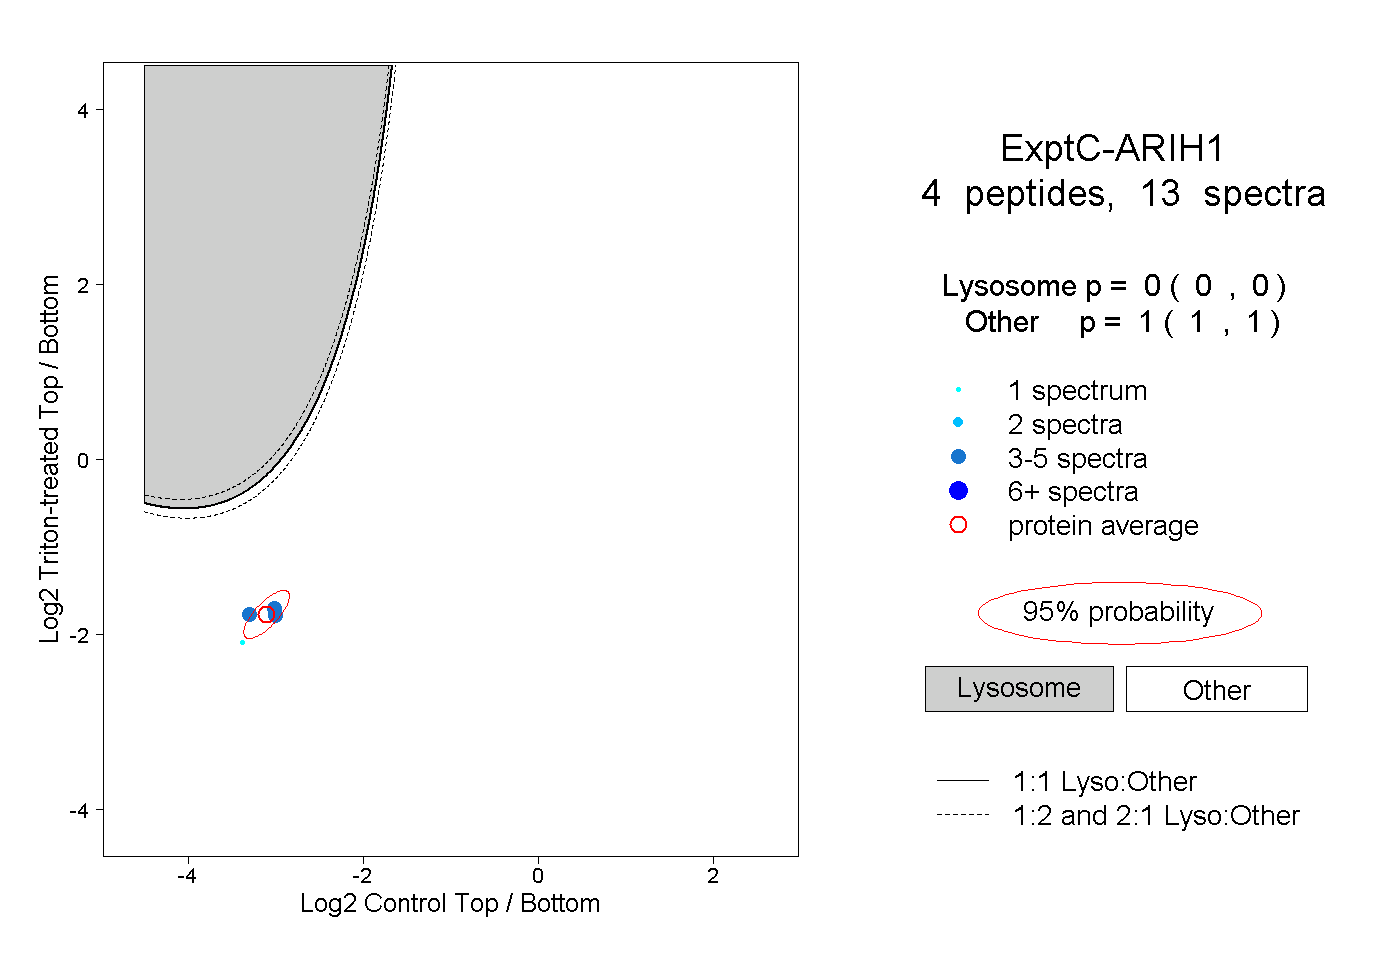
0.000 | 0.000
1.000 | 1.000
1peptide
spectrum
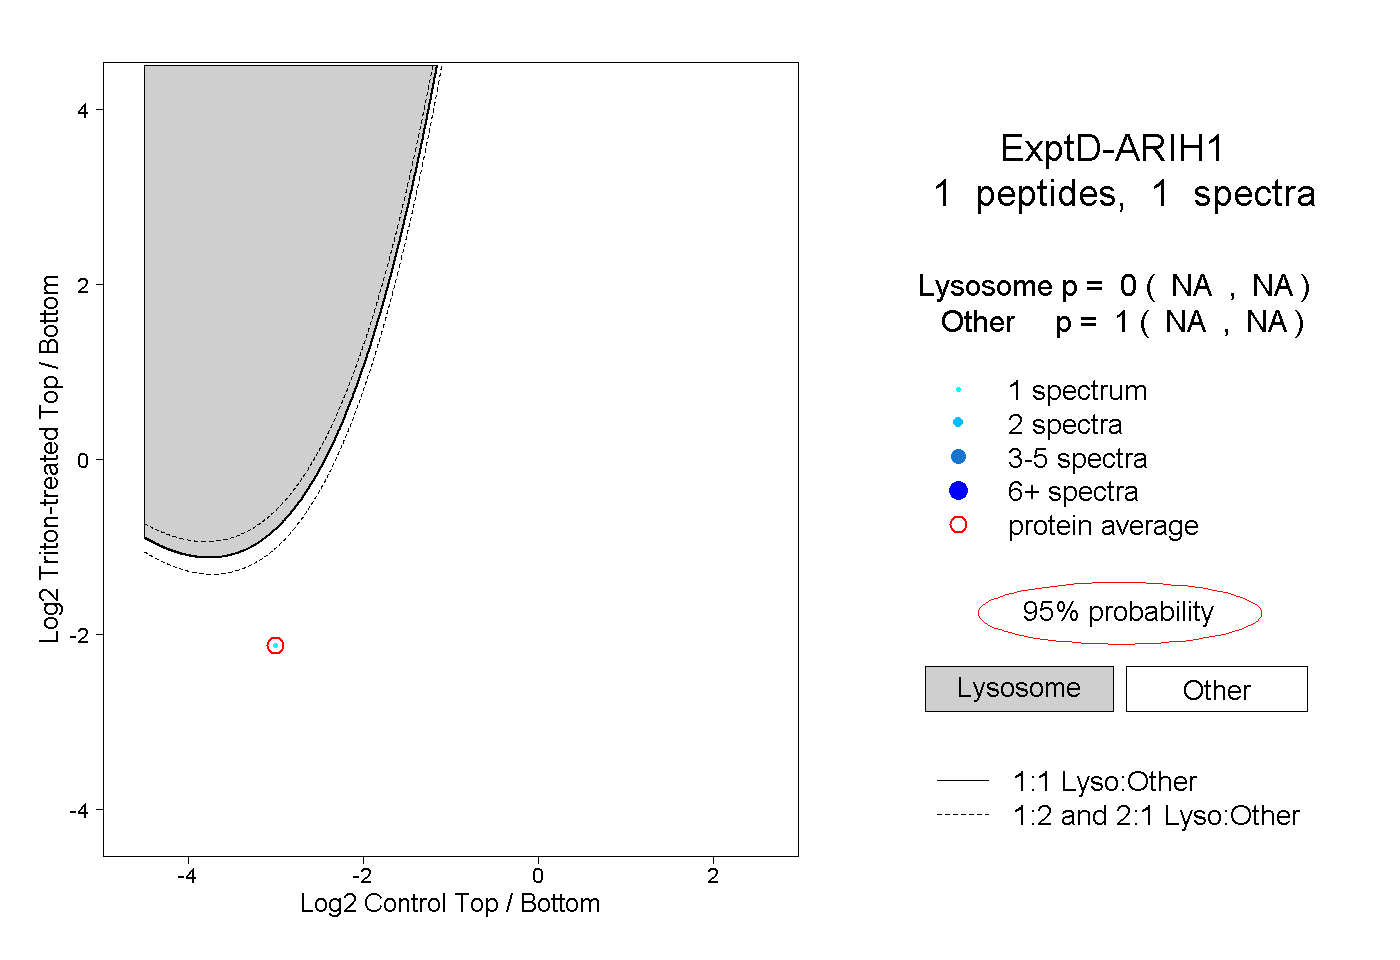
NA | NA
NA | NA