 13
13peptides
spectra
0.031 | 0.053
0.000 | 0.000
0.000 | 0.007
0.000 | 0.000
0.000 | 0.000
0.000 | 0.000
0.945 | 0.963
0.000 | 0.000
| Plot | Mito | Lyso | Perox | ER | Golgi | PM | Cytosol | Nucleus | |||||
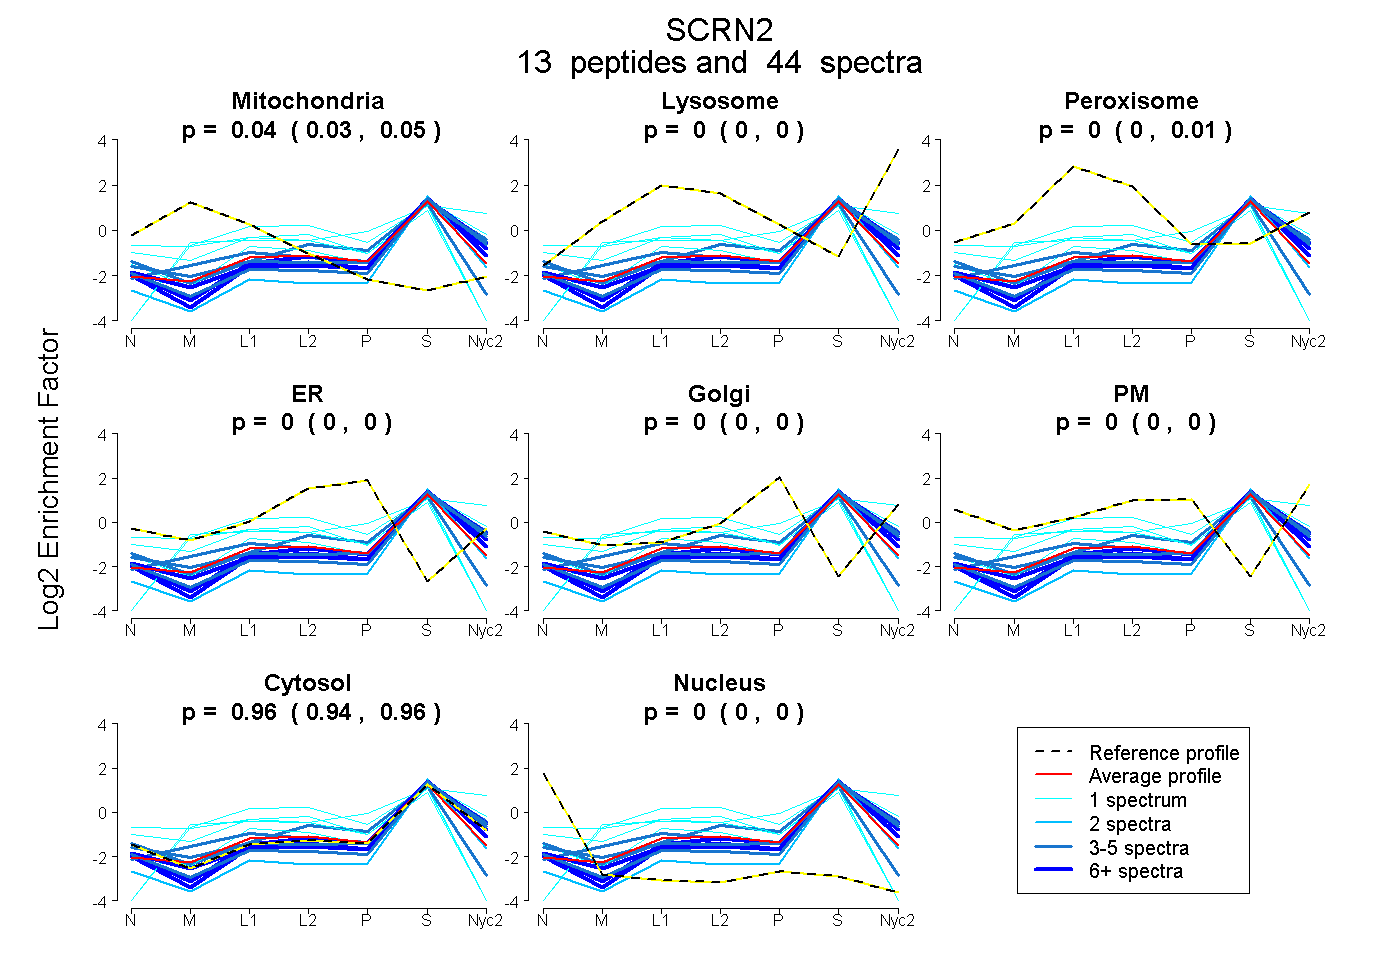
| Expt A |
13 peptides |
44 spectra |
|
0.045 0.031 | 0.053 |
0.000 0.000 | 0.000 |
0.000 0.000 | 0.007 |
0.000 0.000 | 0.000 |
0.000 0.000 | 0.000 |
0.000 0.000 | 0.000 |
0.955 0.945 | 0.963 |
0.000 0.000 | 0.000 |
| 10 spectra, LWAAQR | 0.000 | 0.000 | 0.000 | 0.000 | 0.000 | 0.000 | 1.000 | 0.000 | ||
| 1 spectrum, GHQAALGLMDEQEQAQLR | 0.247 | 0.000 | 0.000 | 0.050 | 0.000 | 0.000 | 0.704 | 0.000 | ||
| 3 spectra, YGQGGSCR | 0.015 | 0.041 | 0.000 | 0.000 | 0.000 | 0.000 | 0.944 | 0.000 | ||
| 6 spectra, SSTAQAAVHVIAGLLDR | 0.000 | 0.000 | 0.000 | 0.000 | 0.000 | 0.000 | 1.000 | 0.000 | ||
| 3 spectra, LQCTYIEVEQVWK | 0.179 | 0.000 | 0.000 | 0.000 | 0.000 | 0.000 | 0.821 | 0.000 | ||
| 8 spectra, AGCEMLQR | 0.000 | 0.000 | 0.000 | 0.000 | 0.000 | 0.000 | 1.000 | 0.000 | ||
| 1 spectrum, DEVQEVVFIPAGTHTPGSR | 0.219 | 0.000 | 0.114 | 0.000 | 0.000 | 0.000 | 0.667 | 0.000 | ||
| 3 spectra, TEAWVLETAGR | 0.000 | 0.000 | 0.000 | 0.000 | 0.000 | 0.000 | 1.000 | 0.000 | ||
| 1 spectrum, QEQQSLEQEGLEALR | 0.408 | 0.000 | 0.000 | 0.000 | 0.000 | 0.000 | 0.586 | 0.006 | ||
| 4 spectra, FQTQVDR | 0.000 | 0.066 | 0.000 | 0.047 | 0.000 | 0.000 | 0.888 | 0.000 | ||
| 2 spectra, ESGICMDSGGFR | 0.000 | 0.000 | 0.000 | 0.000 | 0.000 | 0.000 | 0.956 | 0.044 | ||
| 1 spectrum, NISNQLSIGTDISAEHPELR | 0.000 | 0.271 | 0.070 | 0.000 | 0.000 | 0.000 | 0.658 | 0.000 | ||
| 1 spectrum, IQGGAR | 0.000 | 0.093 | 0.025 | 0.000 | 0.000 | 0.000 | 0.882 | 0.000 |
| Plot | Mito | Lyso or Perox | ER | Golgi | PM | Cytosol | Nucleus | ||||||
| Expt B |
6 peptides |
13 spectra |
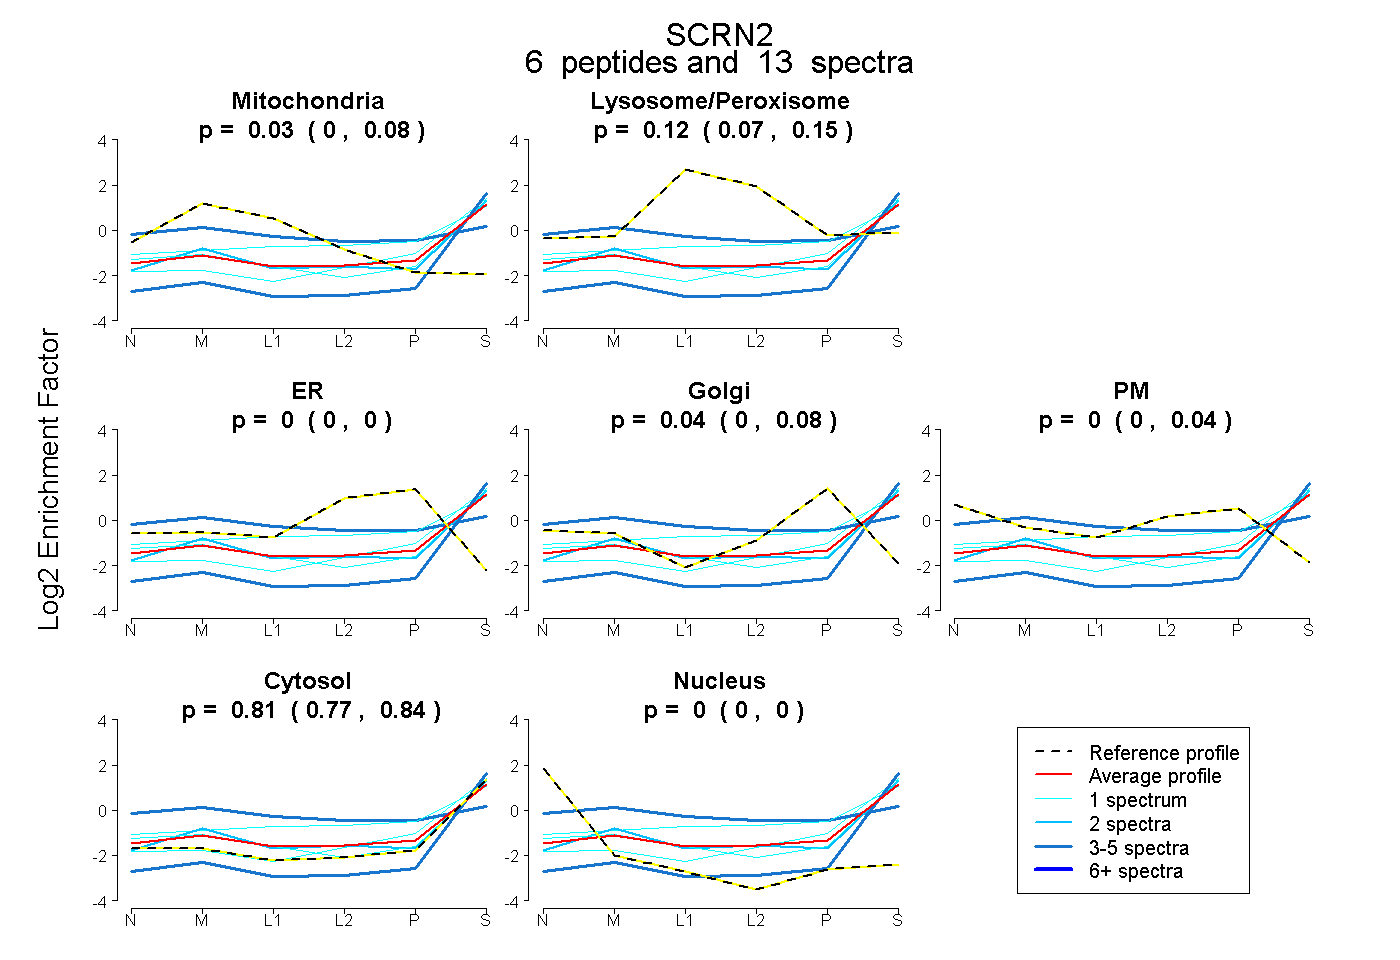 |
0.031 0.000 | 0.077 |
0.116 0.069 | 0.150 |
0.000 0.000 | 0.000 |
0.044 0.000 | 0.080 |
0.000 0.000 | 0.041 |
0.808 0.770 | 0.837 |
0.000 0.000 | 0.000 |
|||
| Plot | Lyso | Other | |||||||||||
| Expt C |
6 peptides |
23 spectra |
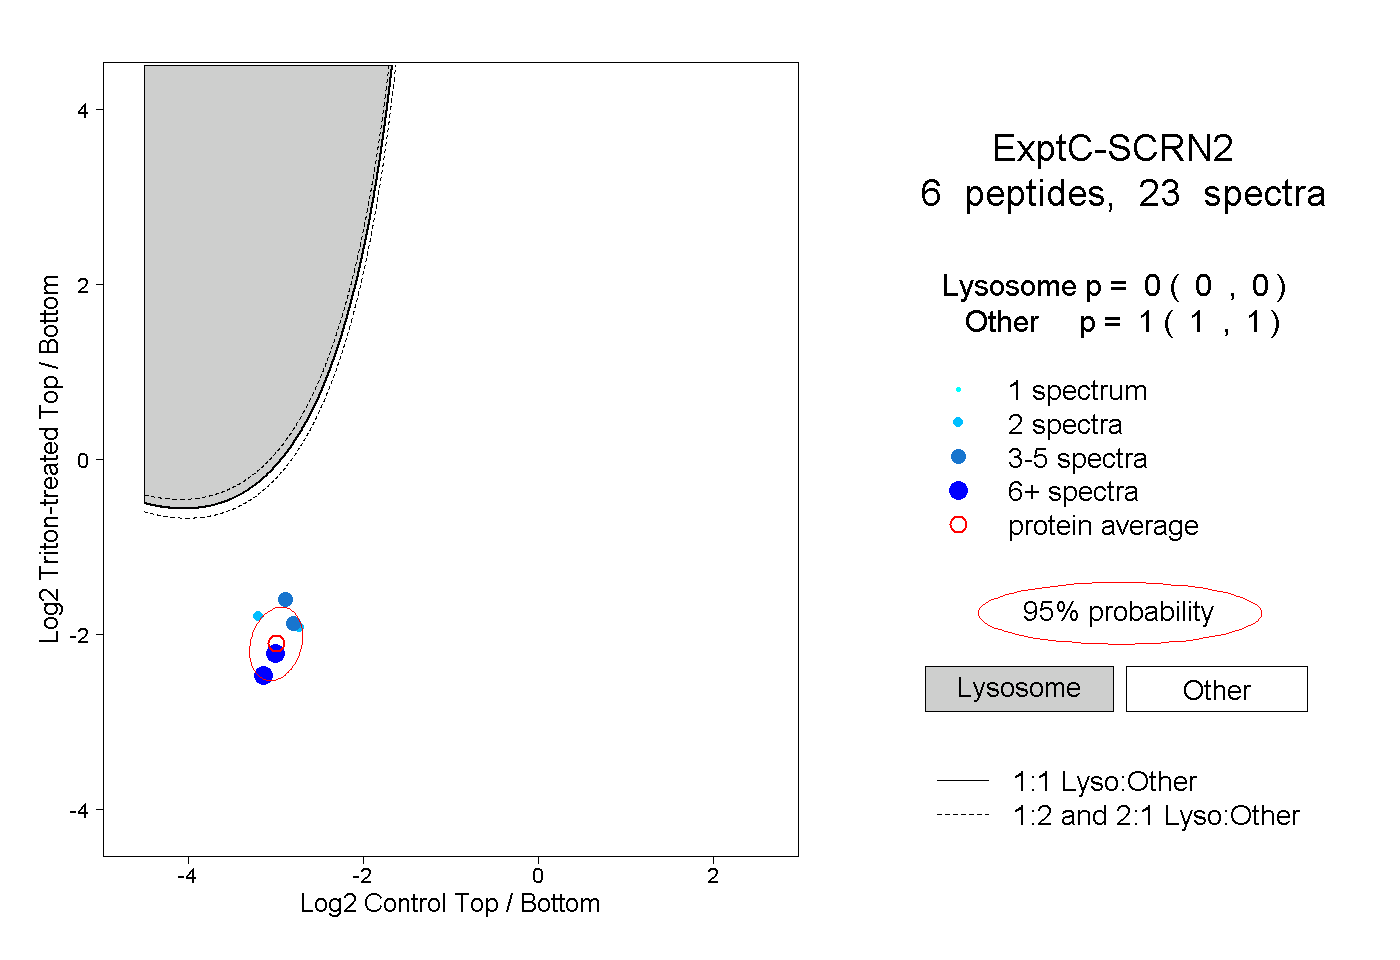 |
0.000 0.000 | 0.000 |
1.000 1.000 | 1.000 |
||||||||
| Plot | Lyso | Other | |||||||||||
| Expt D |
2 peptides |
2 spectra |
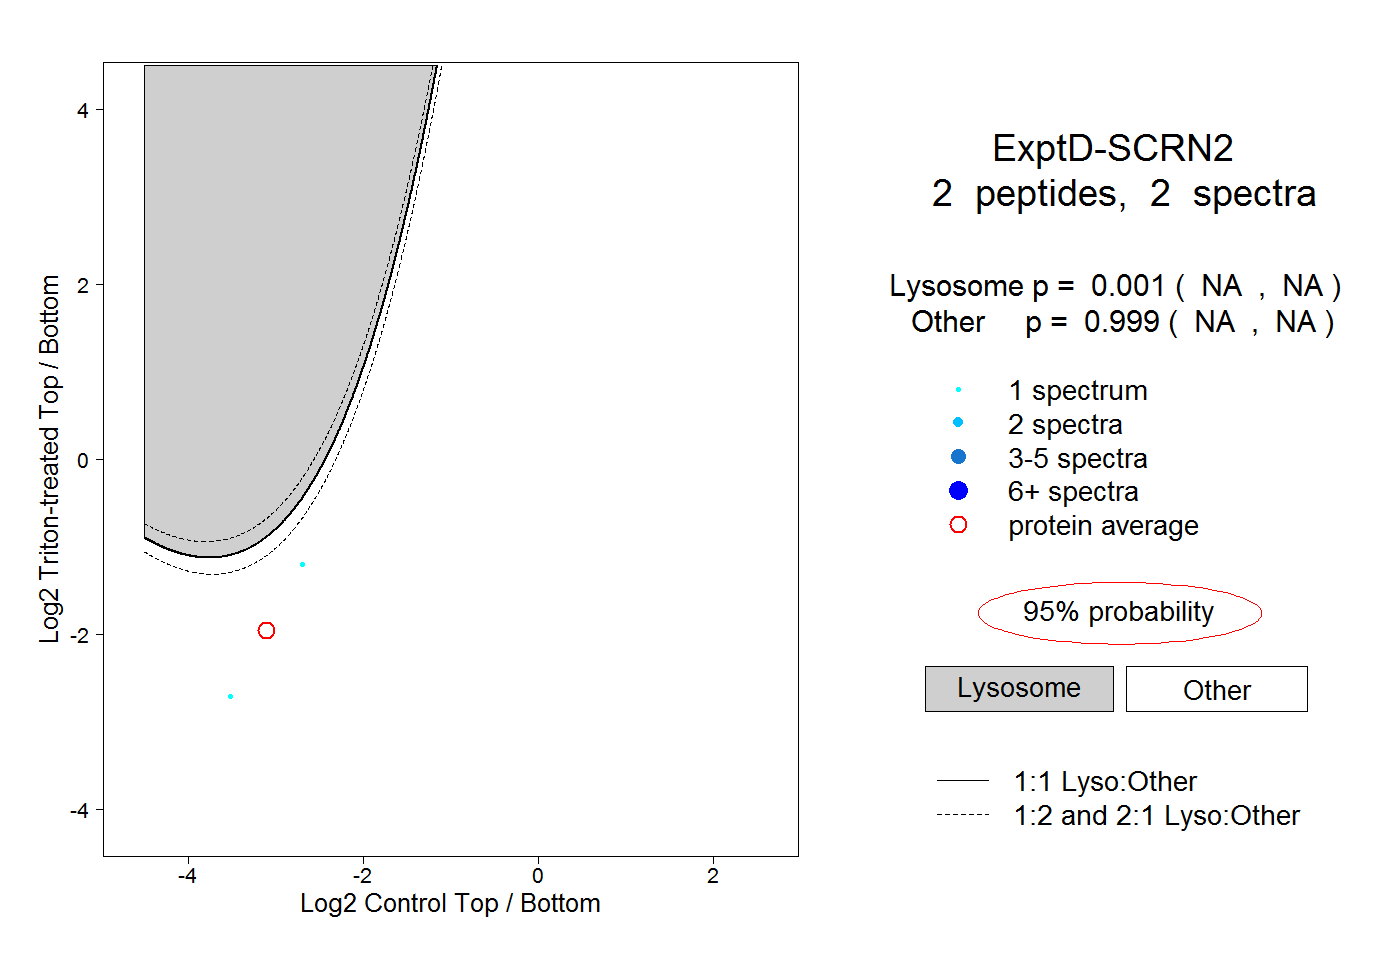 |
0.001 NA | NA |
0.999 NA | NA |