 1
1peptide
spectrum
NA | NA
NA | NA
NA | NA
NA | NA
NA | NA
NA | NA
NA | NA
NA | NA
5peptides
spectra
0.316 | 1.000
0.000 | 0.679
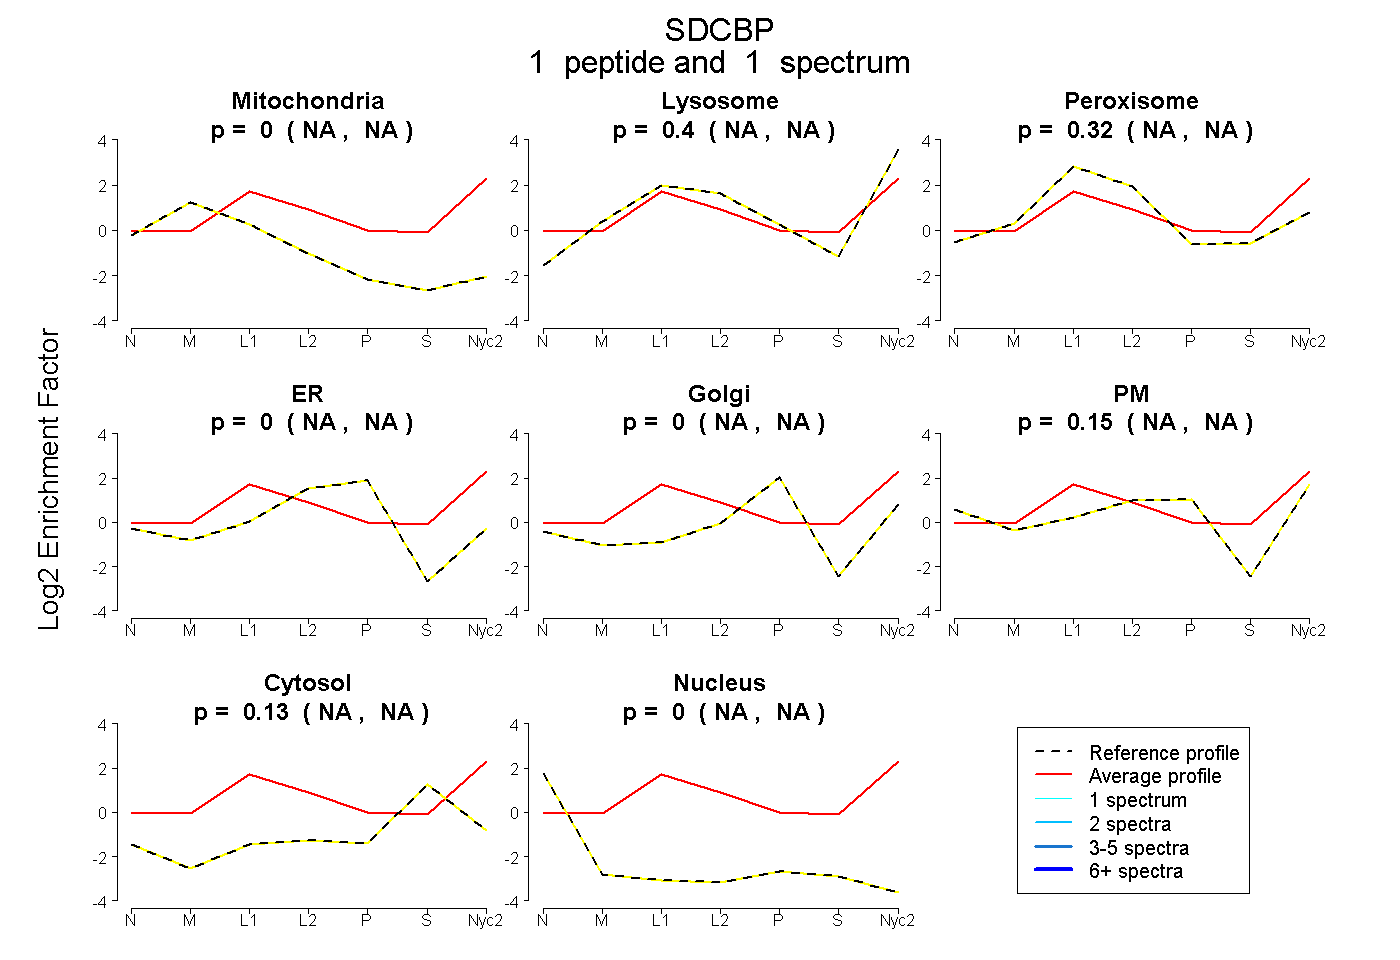
| Plot | Mito | Lyso | Perox | ER | Golgi | PM | Cytosol | Nucleus | |||||
| Expt A |
1 peptide |
1 spectrum |
|
0.000 NA | NA |
0.401 NA | NA |
0.324 NA | NA |
0.000 NA | NA |
0.000 NA | NA |
0.148 NA | NA |
0.127 NA | NA |
0.000 NA | NA |
||
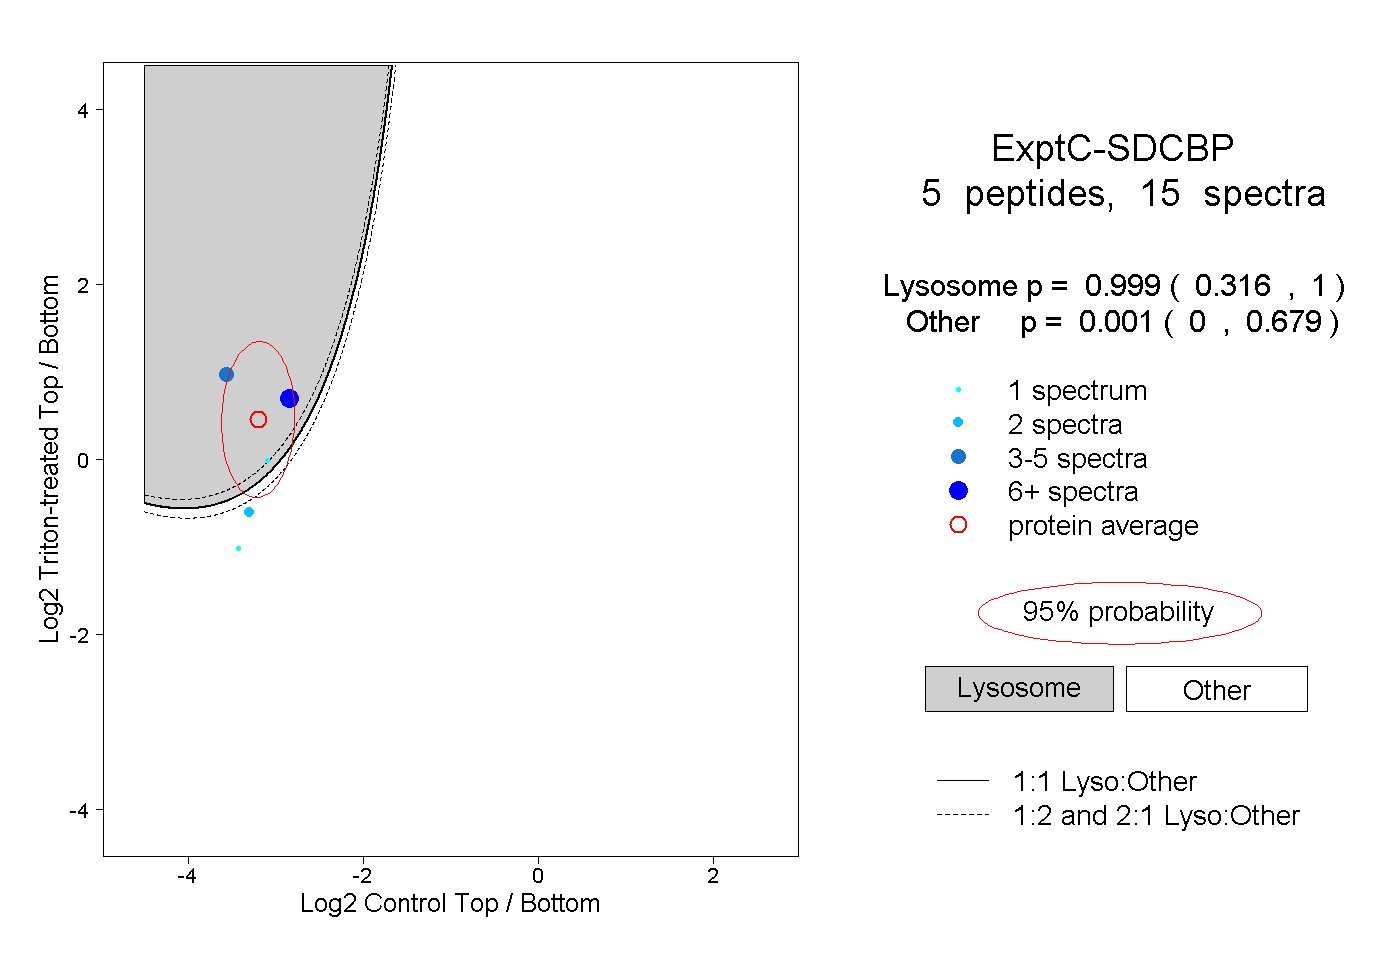
| Plot | Lyso | Other | |||||||||||
| Expt C |
5 peptides |
15 spectra |
|
0.999 0.316 | 1.000 |
0.001 0.000 | 0.679 |
| 2 spectra, SLMDHTIPEV | 0.059 | 0.941 | ||||||||
| 1 spectrum, TVTMHK | 0.001 | 0.999 | ||||||||
| 6 spectra, QAFGEK | 0.994 | 0.006 | ||||||||
| 5 spectra, ITSIVK | 1.000 | 0.000 | ||||||||
| 1 spectrum, ITMTIR | 0.831 | 0.169 |
| Plot | Lyso | Other | |||||||||||
| Expt D |
1 peptide |
1 spectrum |
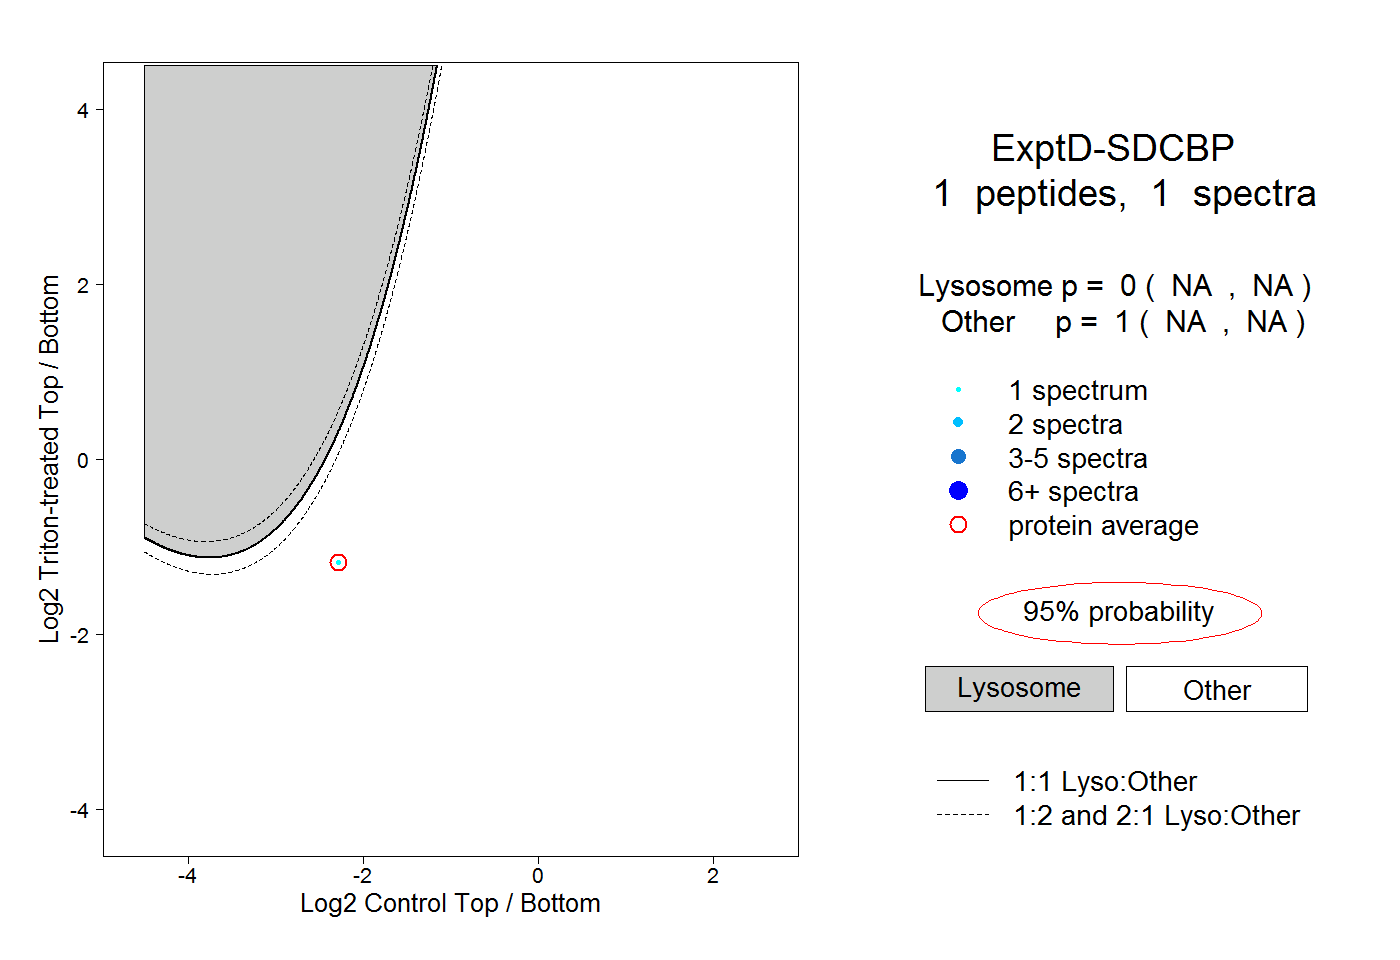 |
0.000 NA | NA |
1.000 NA | NA |