 5
5peptides
spectra
0.737 | 0.807
0.188 | 0.251
0.000 | 0.000
0.000 | 0.000
0.000 | 0.000
0.000 | 0.002
0.000 | 0.000
0.000 | 0.006
| Plot | Mito | Lyso | Perox | ER | Golgi | PM | Cytosol | Nucleus | |||||
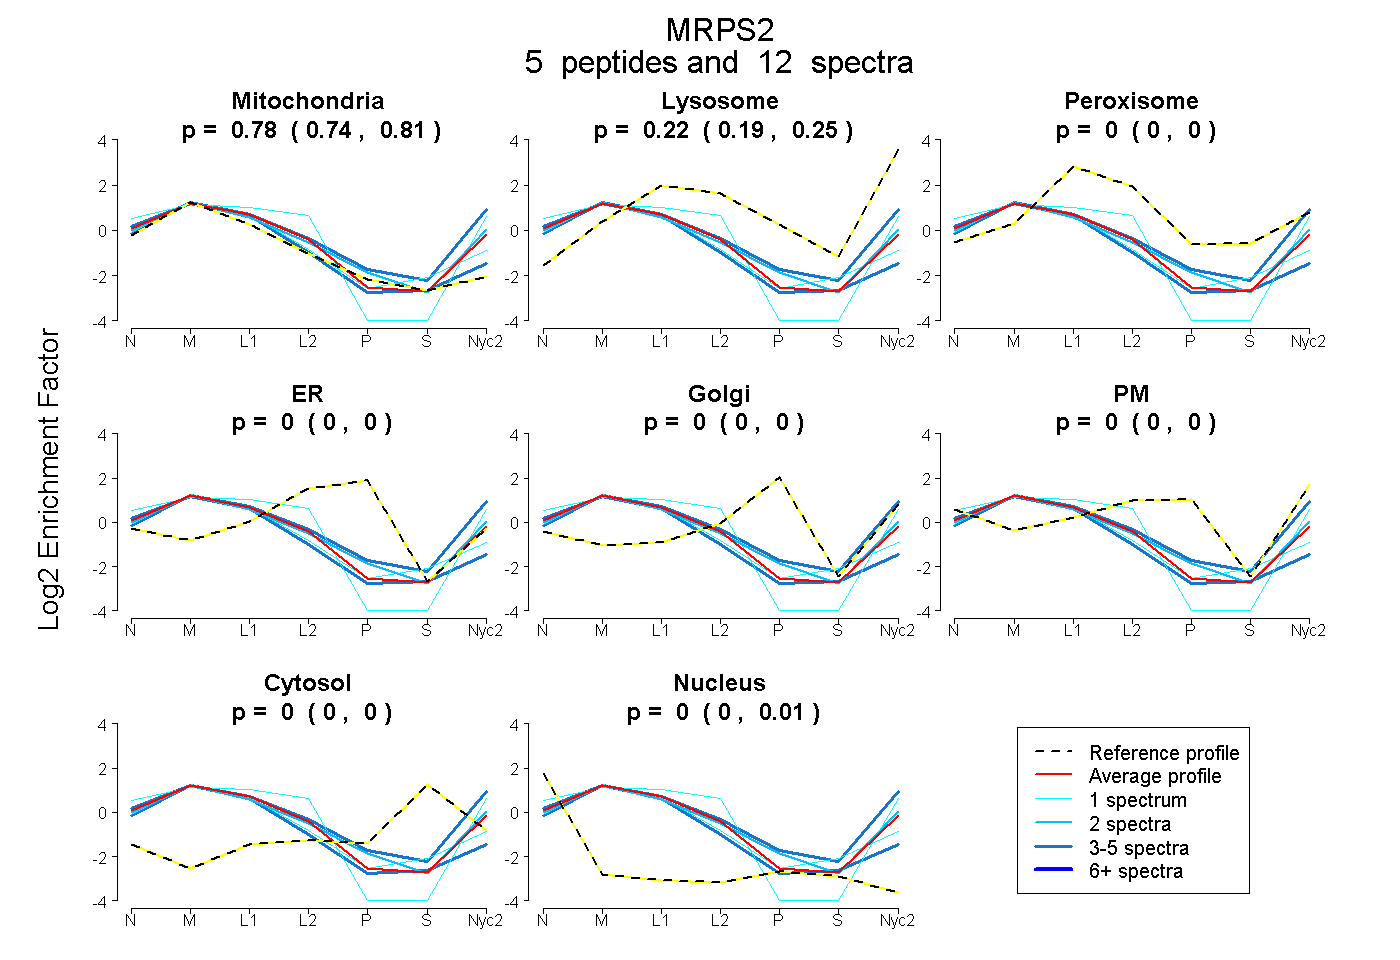
| Expt A |
5 peptides |
12 spectra |
|
0.779 0.737 | 0.807 |
0.221 0.188 | 0.251 |
0.000 0.000 | 0.000 |
0.000 0.000 | 0.000 |
0.000 0.000 | 0.000 |
0.000 0.000 | 0.002 |
0.000 0.000 | 0.000 |
0.000 0.000 | 0.006 |
| 1 spectrum, ILDVPLQHSDFFNVK | 0.841 | 0.106 | 0.049 | 0.000 | 0.000 | 0.000 | 0.004 | 0.000 | ||
| 4 spectra, FMEPYIFGNR | 0.564 | 0.411 | 0.000 | 0.000 | 0.000 | 0.001 | 0.000 | 0.024 | ||
| 2 spectra, VHLGHK | 0.704 | 0.210 | 0.000 | 0.000 | 0.000 | 0.087 | 0.000 | 0.000 | ||
| 4 spectra, GIILFVSR | 0.940 | 0.000 | 0.057 | 0.000 | 0.000 | 0.000 | 0.000 | 0.003 | ||
| 1 spectrum, QMEALHR | 0.749 | 0.251 | 0.000 | 0.000 | 0.000 | 0.000 | 0.000 | 0.000 |
| Plot | Mito | Lyso or Perox | ER | Golgi | PM | Cytosol | Nucleus | ||||||
| Expt B |
3 peptides |
4 spectra |
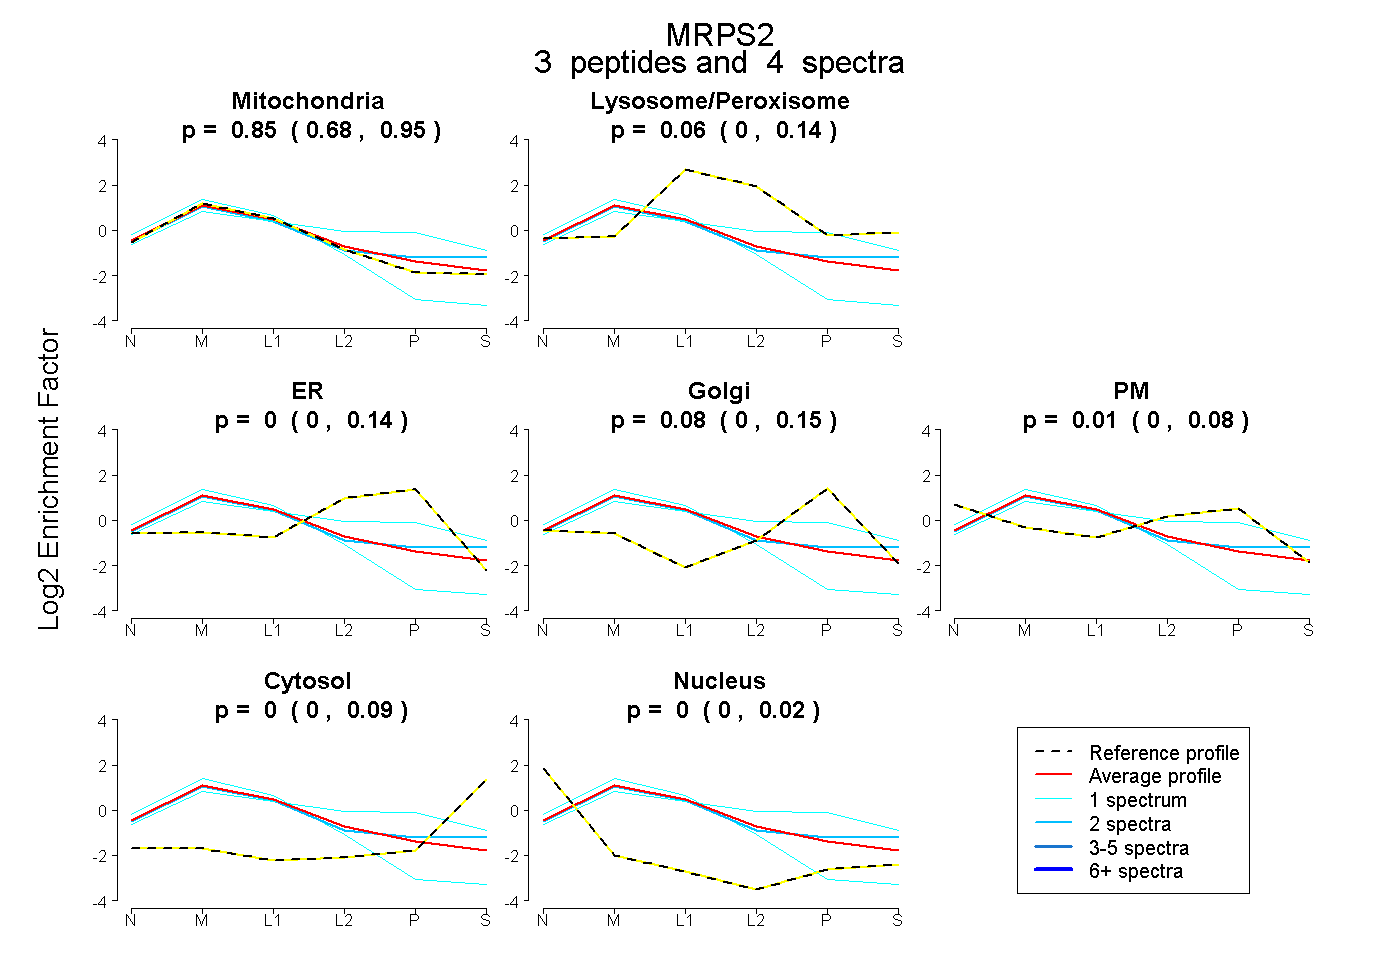 |
0.849 0.678 | 0.947 |
0.058 0.000 | 0.136 |
0.000 0.000 | 0.138 |
0.079 0.000 | 0.155 |
0.014 0.000 | 0.082 |
0.000 0.000 | 0.091 |
0.000 0.000 | 0.022 |
|||
| Plot | Lyso | Other | |||||||||||
| Expt C |
7 peptides |
23 spectra |
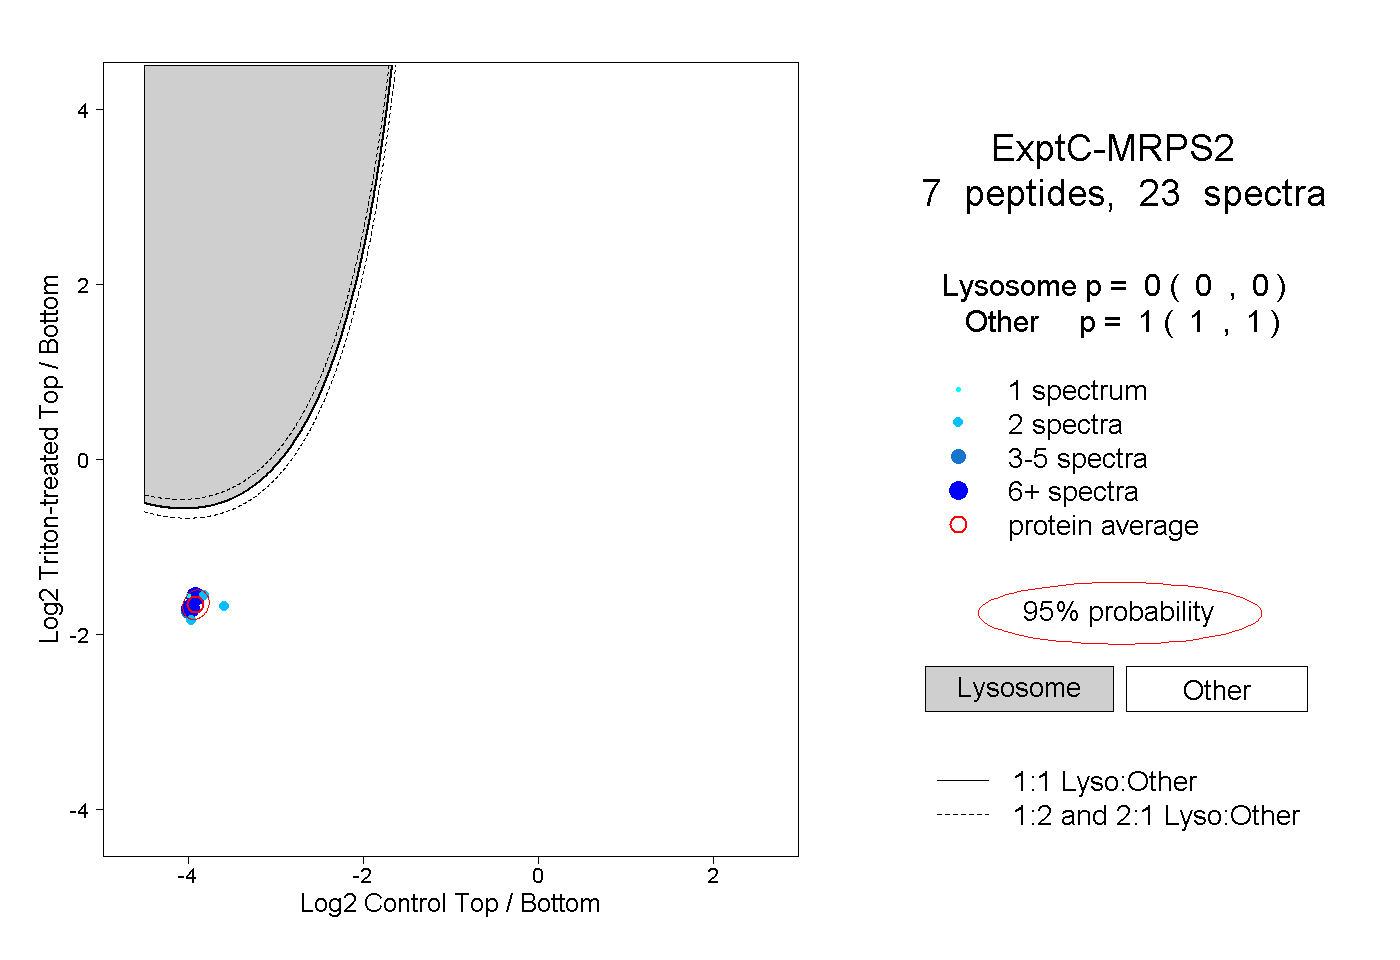 |
0.000 0.000 | 0.000 |
1.000 1.000 | 1.000 |
||||||||
| Plot | Lyso | Other | |||||||||||
| Expt D |
1 peptide |
1 spectrum |
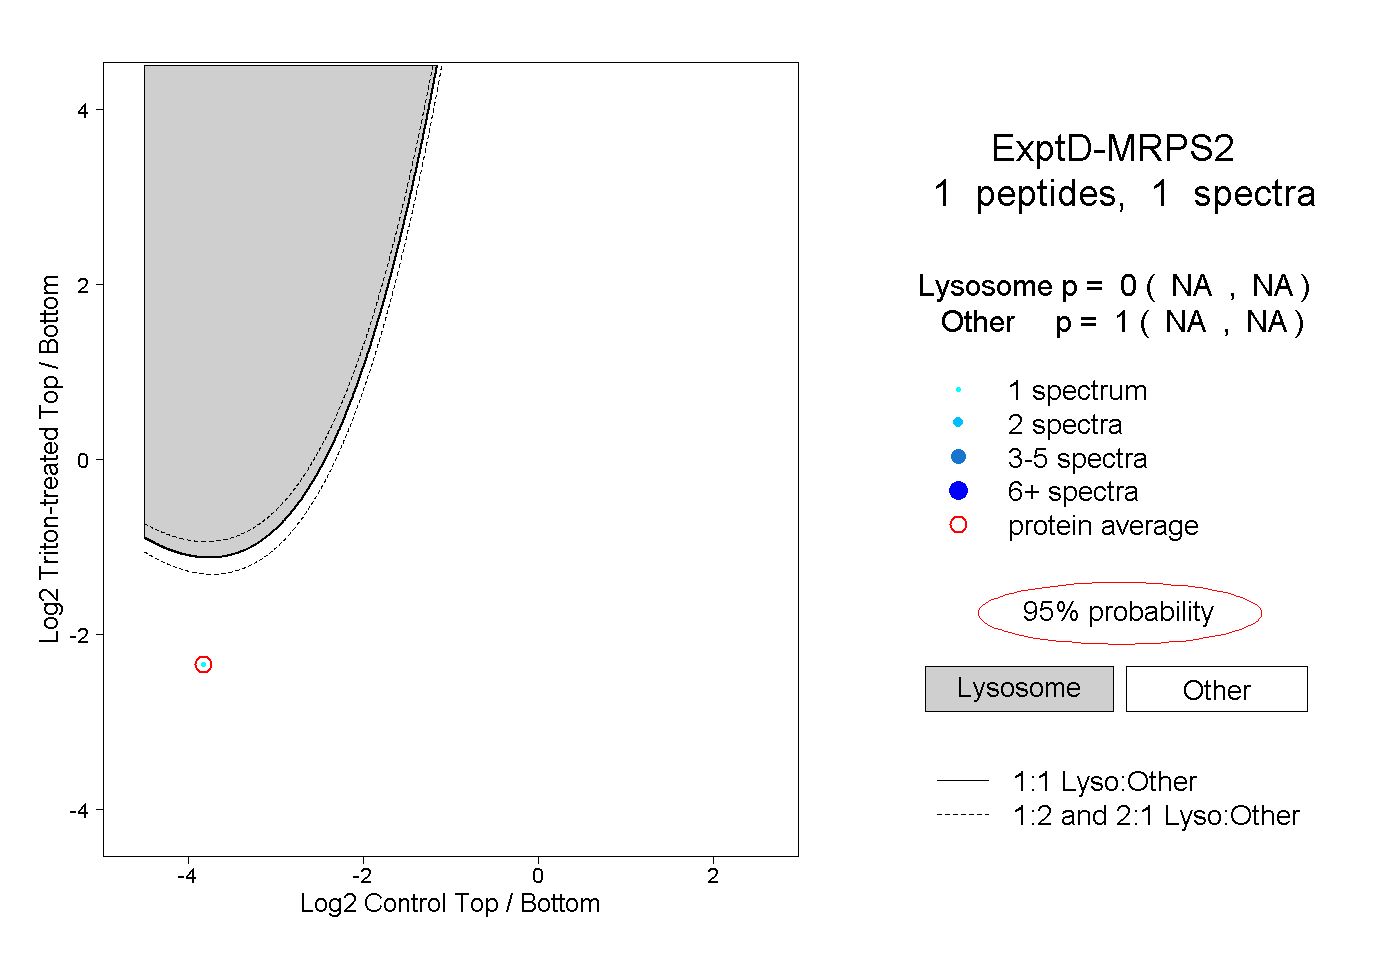 |
0.000 NA | NA |
1.000 NA | NA |