 4
4peptides
spectra
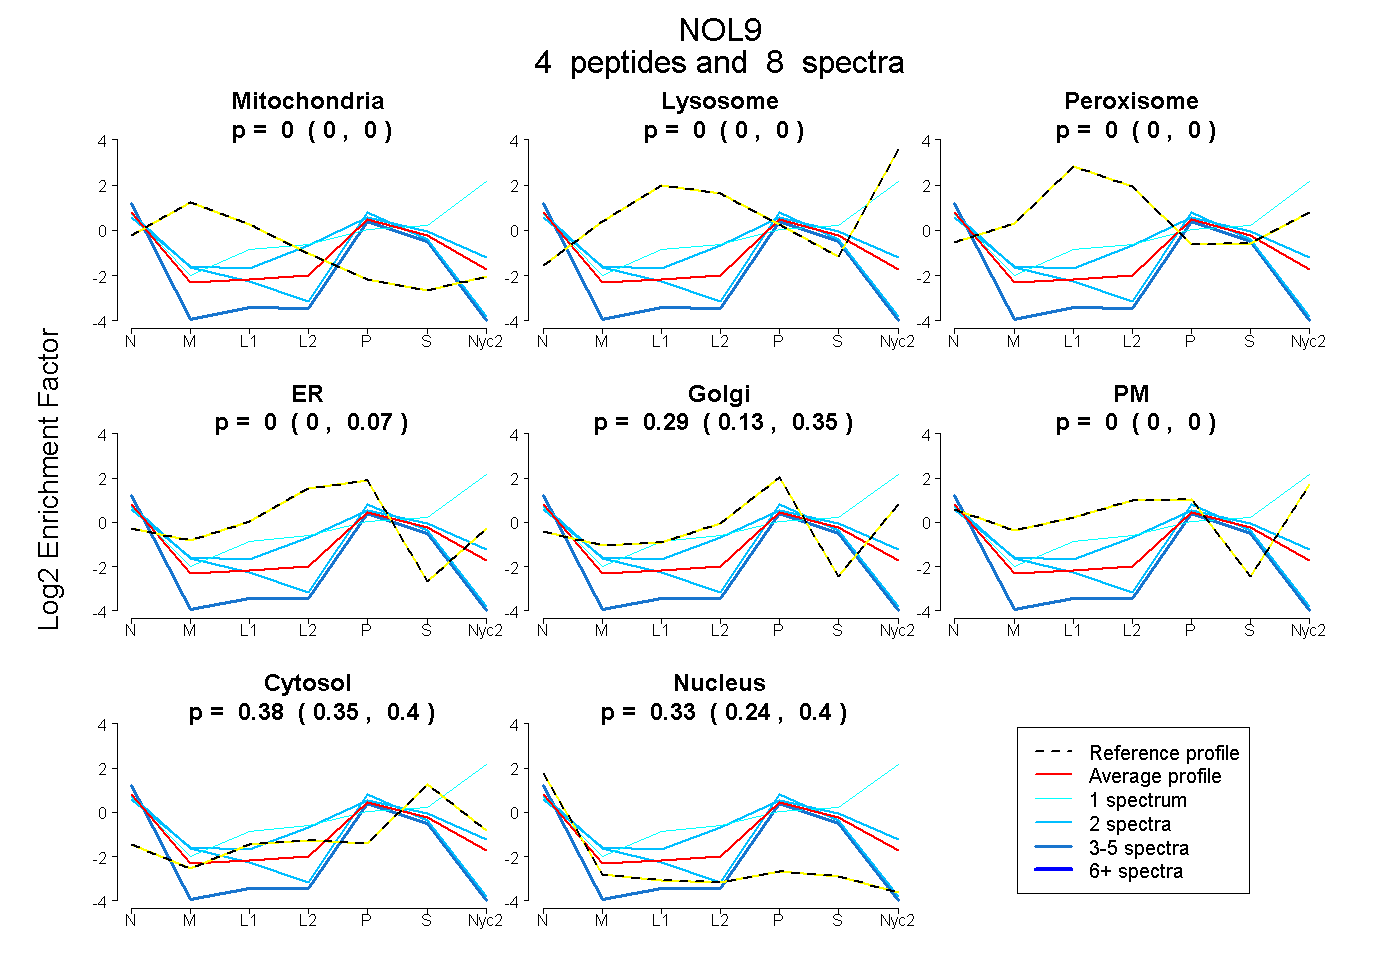
0.000 | 0.000
0.000 | 0.000
0.000 | 0.000
0.000 | 0.073
0.126 | 0.352
0.000 | 0.000
0.351 | 0.403
0.245 | 0.401
| Plot | Mito | Lyso | Perox | ER | Golgi | PM | Cytosol | Nucleus | |||||
| Expt A |
4 peptides |
8 spectra |
|
0.000 0.000 | 0.000 |
0.000 0.000 | 0.000 |
0.000 0.000 | 0.000 |
0.000 0.000 | 0.073 |
0.292 0.126 | 0.352 |
0.000 0.000 | 0.000 |
0.380 0.351 | 0.403 |
0.328 0.245 | 0.401 |
| 2 spectra, DNSEFVALNK | 0.000 | 0.000 | 0.000 | 0.215 | 0.194 | 0.000 | 0.431 | 0.161 | ||
| 3 spectra, ARPHLLLSR | 0.000 | 0.000 | 0.000 | 0.000 | 0.004 | 0.000 | 0.300 | 0.696 | ||
| 1 spectrum, LVDFLR | 0.000 | 0.042 | 0.000 | 0.000 | 0.000 | 0.494 | 0.463 | 0.000 | ||
| 2 spectra, LGVPAGAHVAVK | 0.000 | 0.000 | 0.000 | 0.000 | 0.190 | 0.000 | 0.280 | 0.529 |
| Plot | Lyso | Other | |||||||||||
| Expt C |
1 peptide |
1 spectrum |
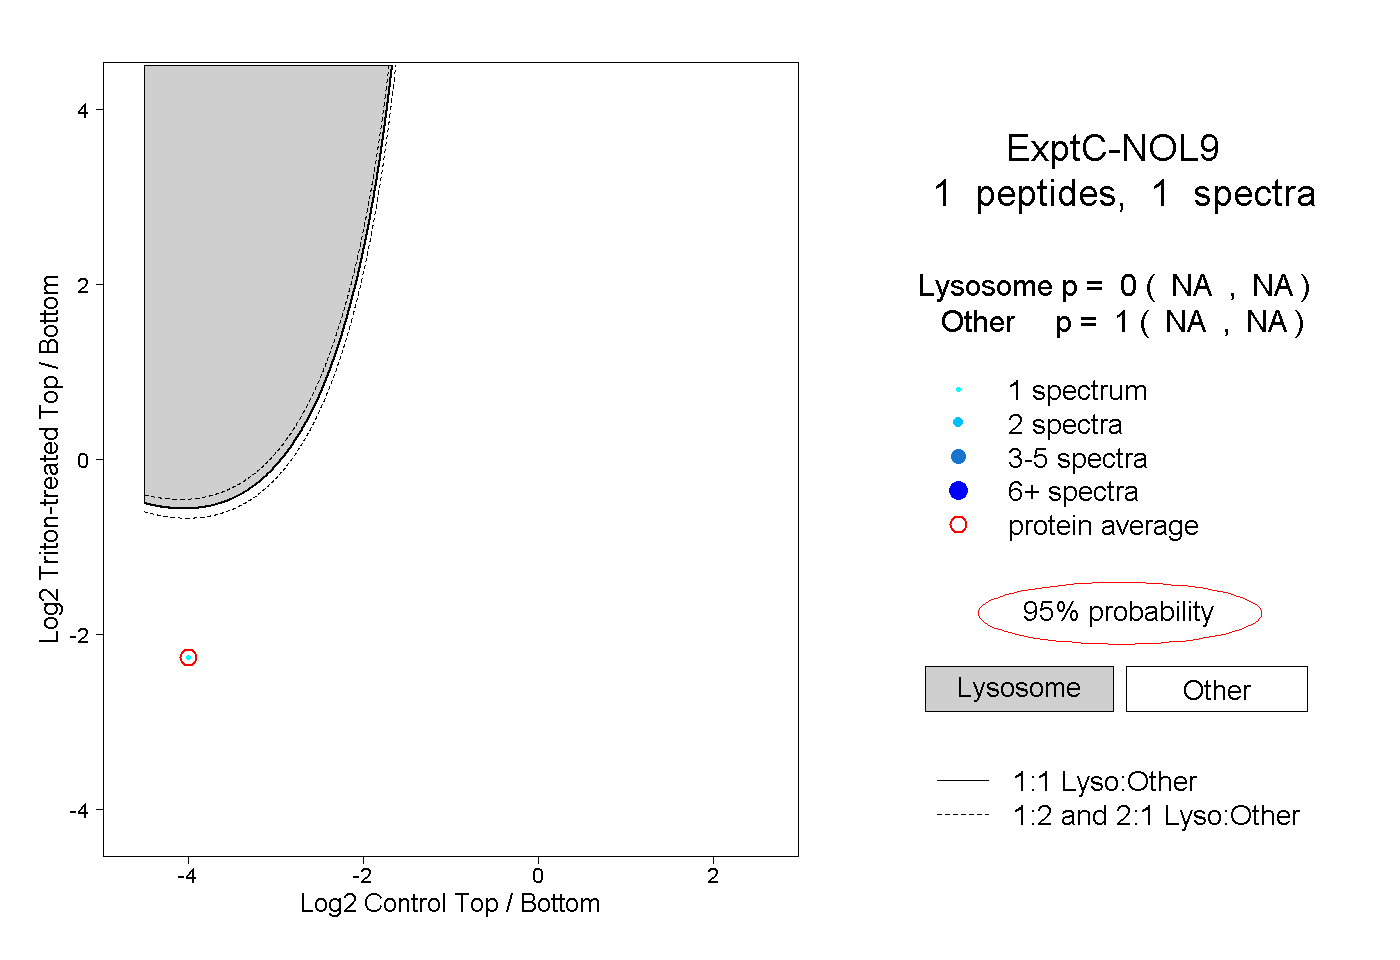 |
0.000 NA | NA |
1.000 NA | NA |
||||||||
| Plot | Lyso | Other | |||||||||||
| Expt D |
1 peptide |
1 spectrum |
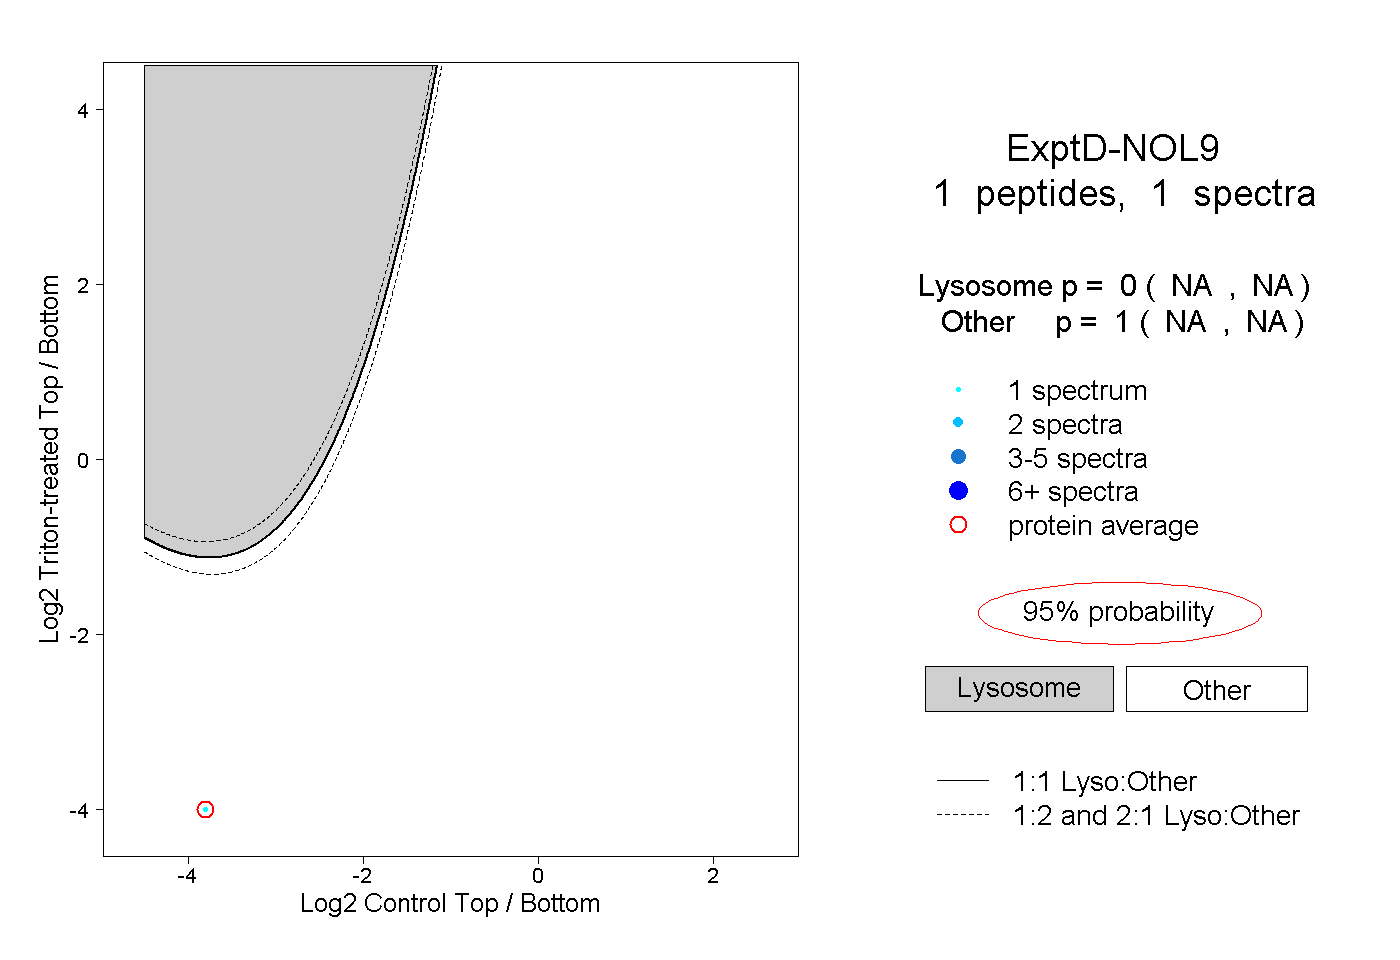 |
0.000 NA | NA |
1.000 NA | NA |