 14
14peptides
spectra
0.738 | 0.751
0.000 | 0.000
0.153 | 0.166
0.000 | 0.000
0.000 | 0.000
0.000 | 0.000
0.091 | 0.098
0.000 | 0.000
| Plot | Mito | Lyso | Perox | ER | Golgi | PM | Cytosol | Nucleus | |||||
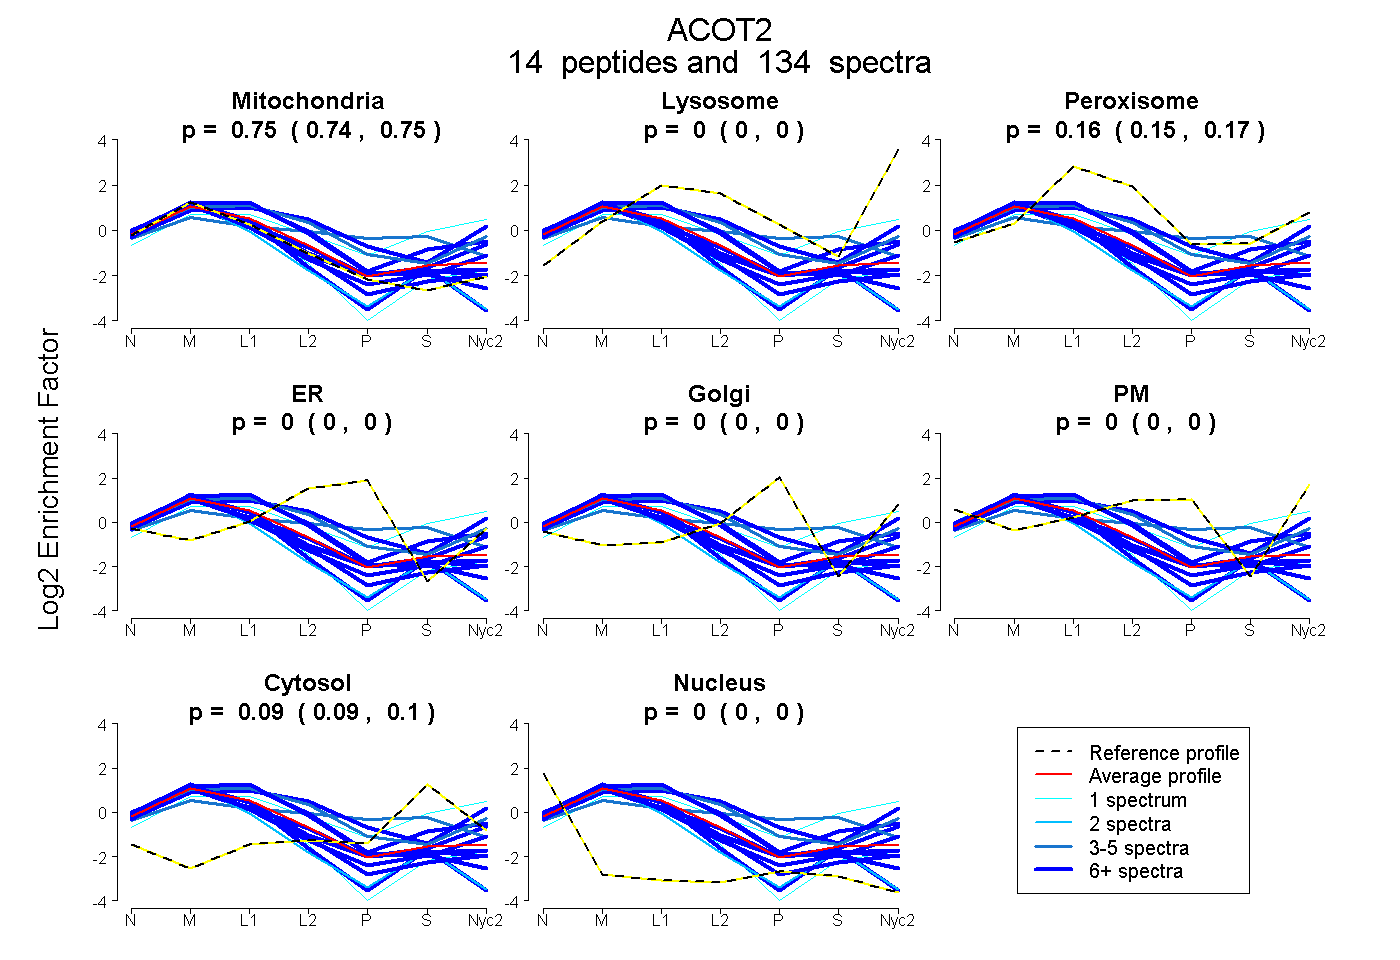
| Expt A |
14 peptides |
134 spectra |
|
0.745 0.738 | 0.751 |
0.000 0.000 | 0.000 |
0.160 0.153 | 0.166 |
0.000 0.000 | 0.000 |
0.000 0.000 | 0.000 |
0.000 0.000 | 0.000 |
0.095 0.091 | 0.098 |
0.000 0.000 | 0.000 |
| 7 spectra, GGELGLAMASFLK | 0.915 | 0.000 | 0.000 | 0.000 | 0.000 | 0.000 | 0.000 | 0.085 | ||
| 6 spectra, SEFYAR | 0.855 | 0.000 | 0.061 | 0.000 | 0.000 | 0.000 | 0.084 | 0.000 | ||
| 3 spectra, LQAHGK | 0.472 | 0.046 | 0.366 | 0.000 | 0.000 | 0.107 | 0.010 | 0.000 | ||
| 8 spectra, SFIPVER | 0.917 | 0.000 | 0.000 | 0.000 | 0.000 | 0.000 | 0.047 | 0.036 | ||
| 9 spectra, LAQAVHER | 0.820 | 0.000 | 0.089 | 0.000 | 0.000 | 0.000 | 0.091 | 0.000 | ||
| 1 spectrum, APALGGSFTGLEPMGLIWAMEPERPLWR | 0.974 | 0.000 | 0.000 | 0.000 | 0.000 | 0.000 | 0.000 | 0.026 | ||
| 6 spectra, IEYFEEAVNYLR | 0.954 | 0.000 | 0.000 | 0.000 | 0.000 | 0.000 | 0.023 | 0.023 | ||
| 8 spectra, ADAGGELDLAR | 0.724 | 0.155 | 0.000 | 0.000 | 0.000 | 0.000 | 0.101 | 0.020 | ||
| 50 spectra, HFMAPGVR | 0.392 | 0.132 | 0.286 | 0.000 | 0.000 | 0.167 | 0.022 | 0.000 | ||
| 9 spectra, SCWDEPLSITVR | 0.687 | 0.000 | 0.313 | 0.000 | 0.000 | 0.000 | 0.000 | 0.000 | ||
| 2 spectra, GPGIGLLGISK | 0.867 | 0.000 | 0.000 | 0.000 | 0.000 | 0.000 | 0.000 | 0.133 | ||
| 1 spectrum, ASLLAGK | 0.290 | 0.265 | 0.189 | 0.000 | 0.000 | 0.000 | 0.257 | 0.000 | ||
| 3 spectra, GFAVMALAYYNYDDLPK | 0.335 | 0.000 | 0.241 | 0.148 | 0.000 | 0.000 | 0.275 | 0.000 | ||
| 21 spectra, GLAPEQPVTLR | 0.476 | 0.000 | 0.413 | 0.000 | 0.000 | 0.000 | 0.111 | 0.000 |
| Plot | Mito | Lyso or Perox | ER | Golgi | PM | Cytosol | Nucleus | ||||||
| Expt B |
13 peptides |
45 spectra |
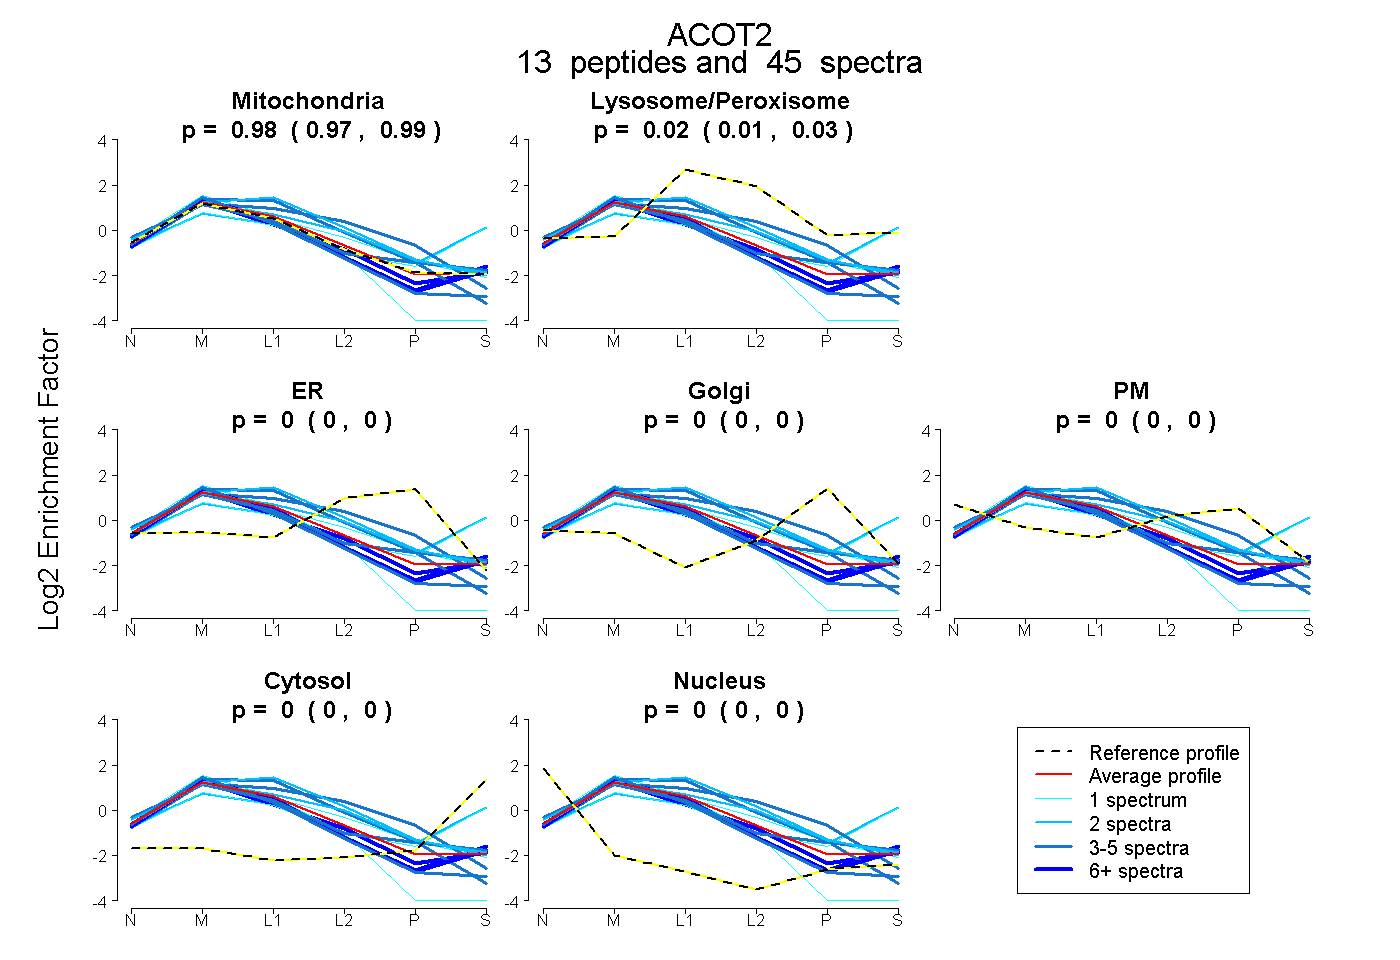 |
0.980 0.968 | 0.989 |
0.020 0.008 | 0.030 |
0.000 0.000 | 0.000 |
0.000 0.000 | 0.000 |
0.000 0.000 | 0.000 |
0.000 0.000 | 0.000 |
0.000 0.000 | 0.000 |
|||
| Plot | Lyso | Other | |||||||||||
| Expt C |
16 peptides |
402 spectra |
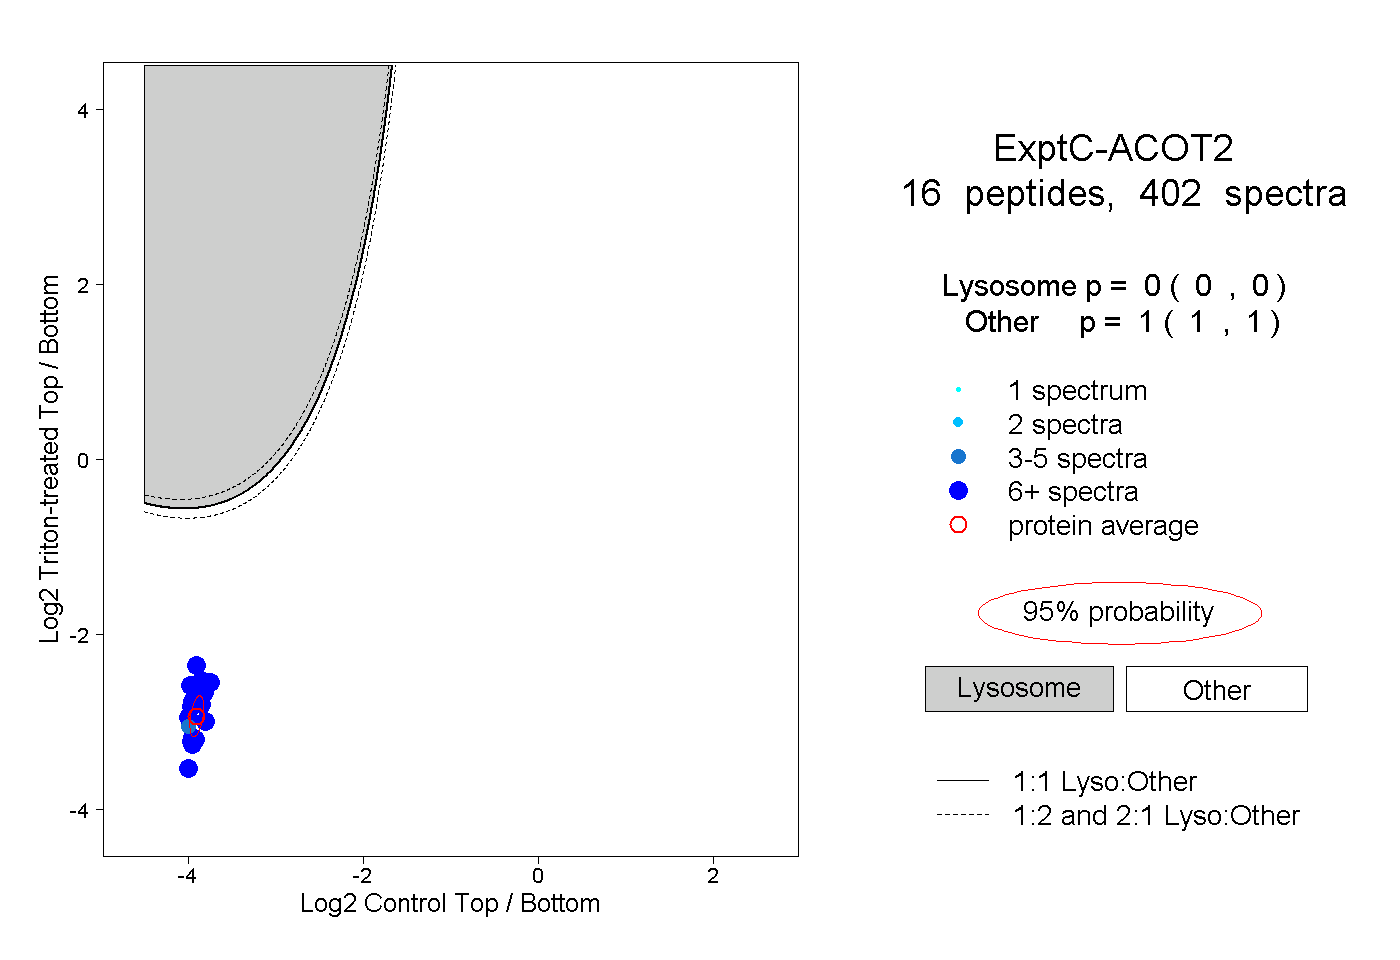 |
0.000 0.000 | 0.000 |
1.000 1.000 | 1.000 |
||||||||
| Plot | Lyso | Other | |||||||||||
| Expt D |
10 peptides |
46 spectra |
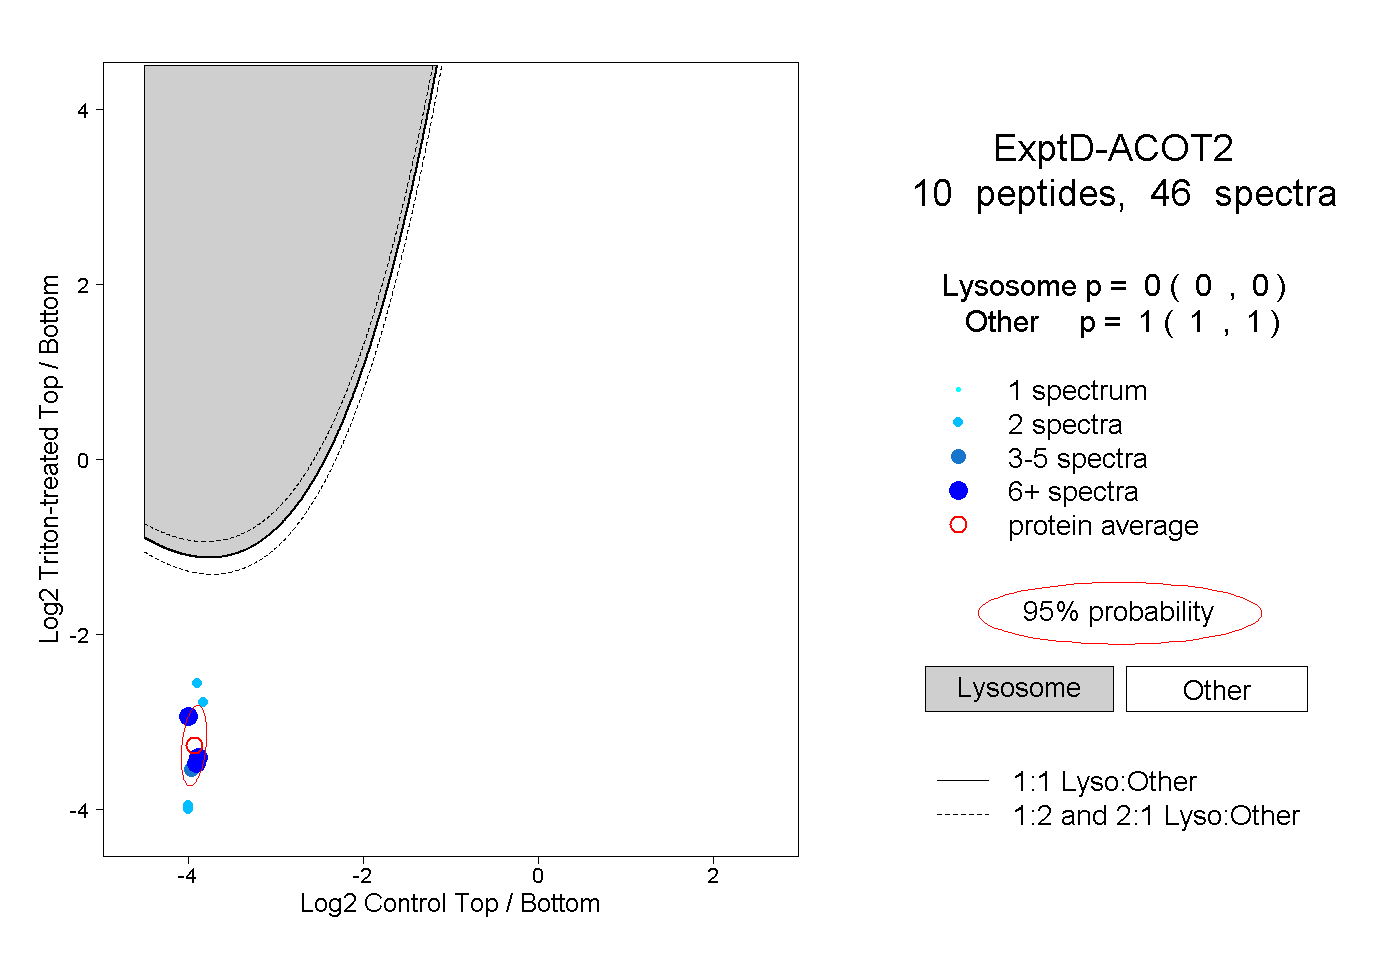 |
0.000 0.000 | 0.000 |
1.000 1.000 | 1.000 |