 3
3peptides
spectra
0.000 | 0.294
0.000 | 0.000
0.032 | 0.238
0.000 | 0.083
0.000 | 0.000
0.000 | 0.000
0.384 | 0.469
0.165 | 0.371
1peptide
spectrum
NA | NA
NA | NA
NA | NA
NA | NA
NA | NA
NA | NA
NA | NA
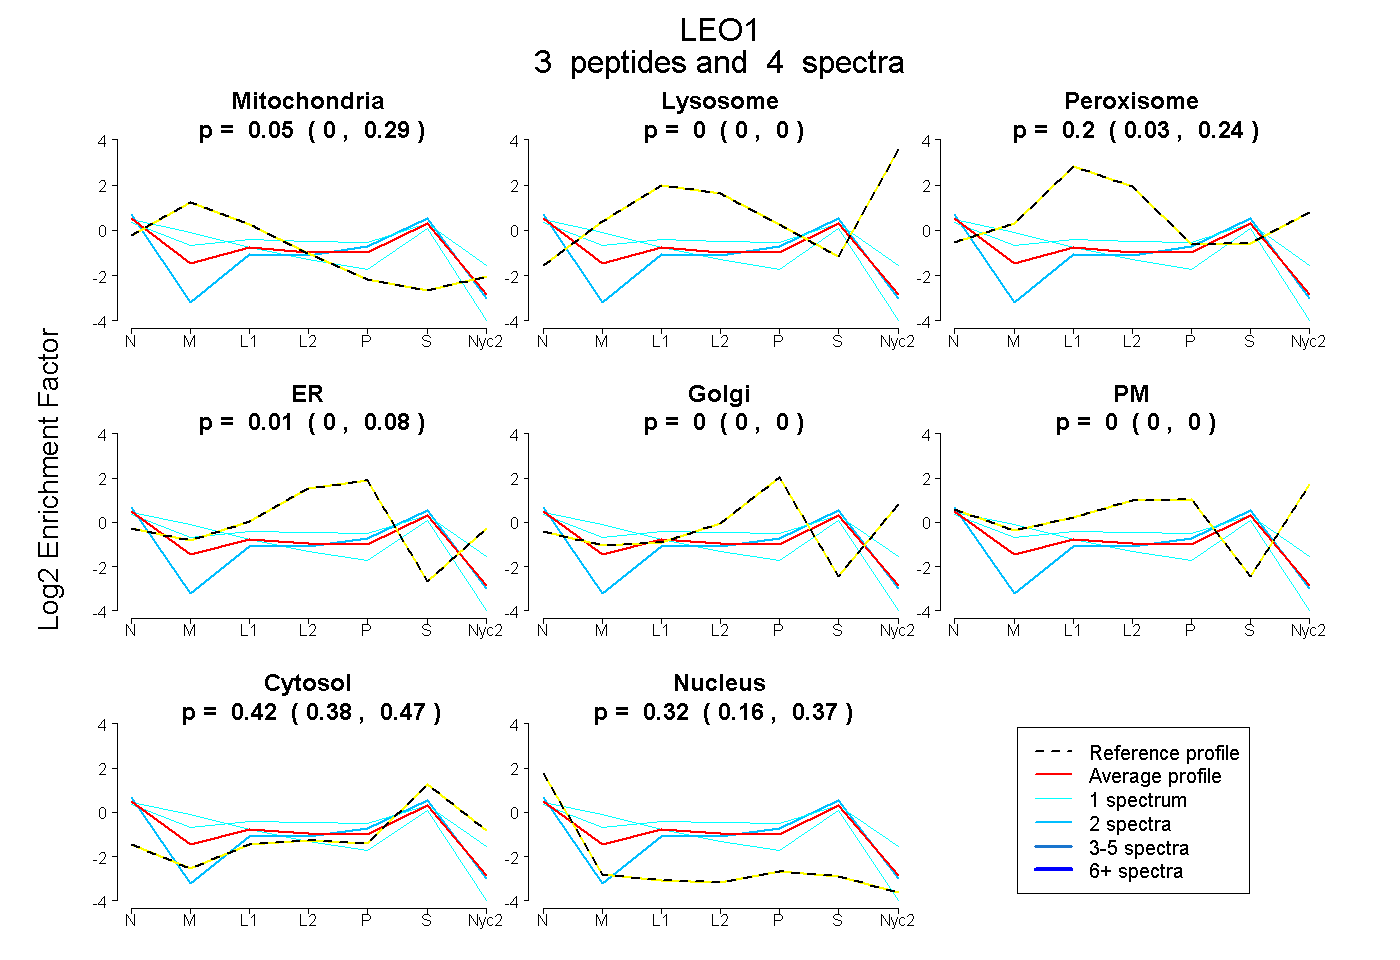
| Plot | Mito | Lyso | Perox | ER | Golgi | PM | Cytosol | Nucleus | |||||
| Expt A |
3 peptides |
4 spectra |
|
0.051 0.000 | 0.294 |
0.000 0.000 | 0.000 |
0.200 0.032 | 0.238 |
0.009 0.000 | 0.083 |
0.000 0.000 | 0.000 |
0.000 0.000 | 0.000 |
0.416 0.384 | 0.469 |
0.323 0.165 | 0.371 |
||
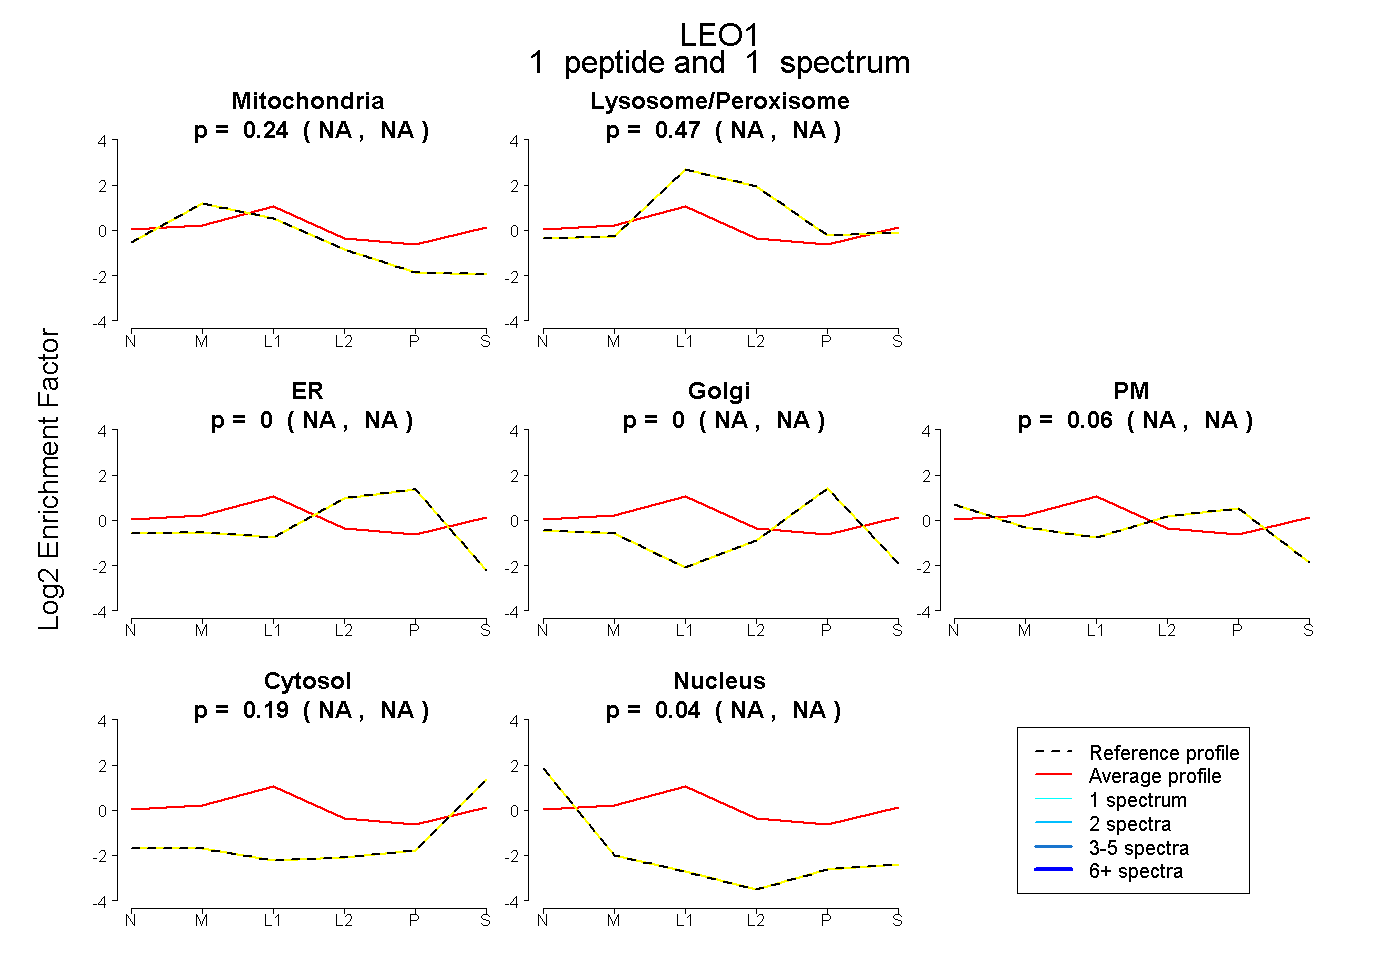
| Plot | Mito | Lyso or Perox | ER | Golgi | PM | Cytosol | Nucleus | ||||||
| Expt B |
1 peptide |
1 spectrum |
|
0.239 NA | NA |
0.472 NA | NA |
0.000 NA | NA |
0.000 NA | NA |
0.057 NA | NA |
0.191 NA | NA |
0.041 NA | NA |