 1
1peptide
spectra
0.000 | 0.000
0.918 | 1.000
0.000 | 0.071
0.000 | 0.000
0.000 | 0.000
0.000 | 0.000
0.000 | 0.000
0.000 | 0.000
1peptide
spectrum
NA | NA
NA | NA
NA | NA
NA | NA
NA | NA
NA | NA
NA | NA
| Plot | Mito | Lyso | Perox | ER | Golgi | PM | Cytosol | Nucleus | |||||
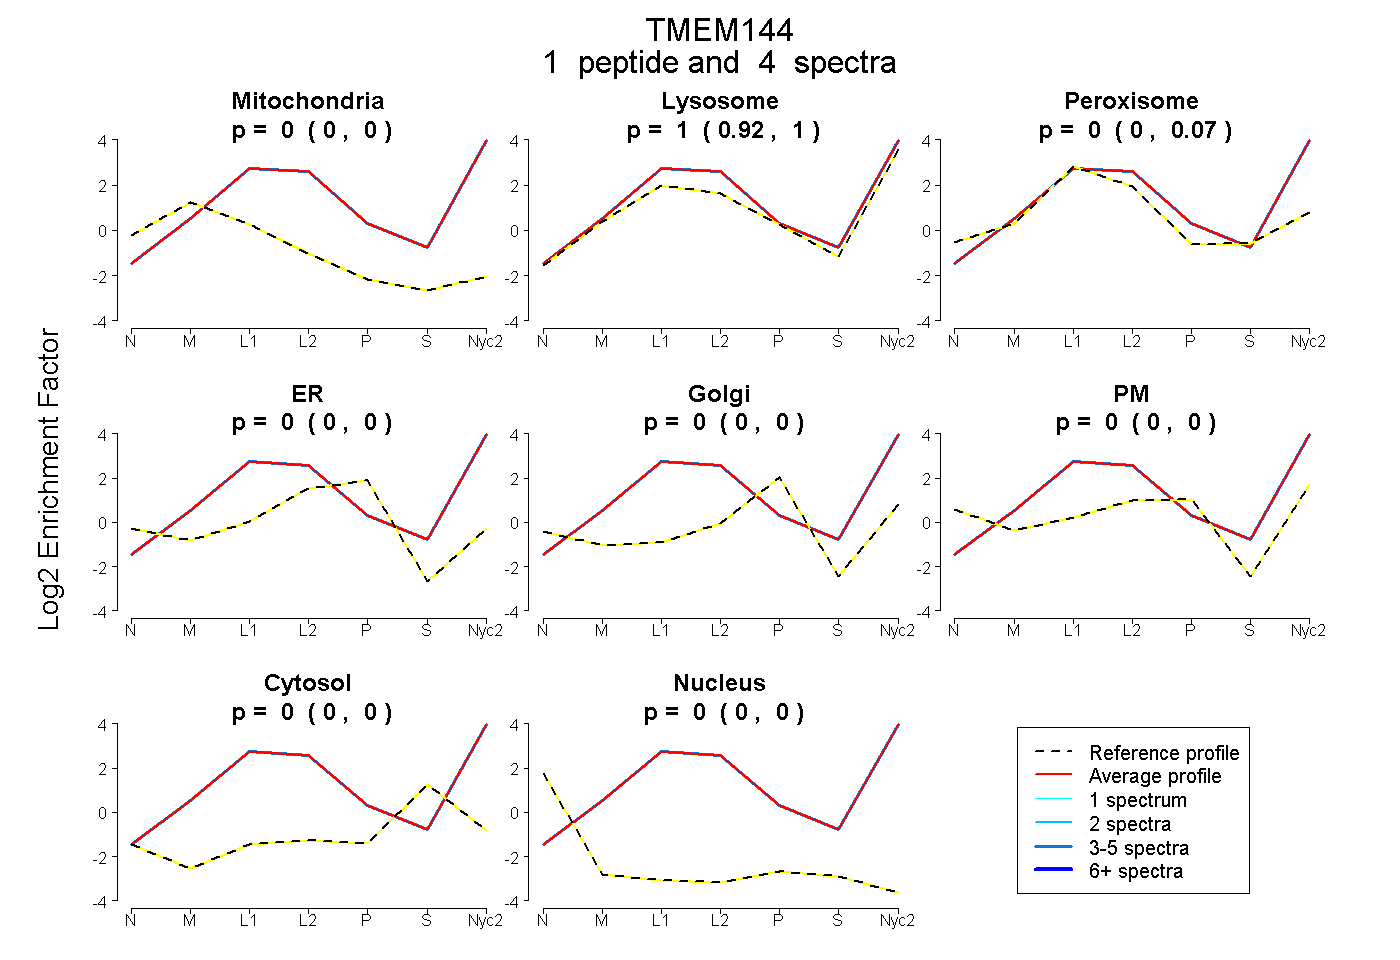
| Expt A |
1 peptide |
4 spectra |
|
0.000 0.000 | 0.000 |
0.999 0.918 | 1.000 |
0.001 0.000 | 0.071 |
0.000 0.000 | 0.000 |
0.000 0.000 | 0.000 |
0.000 0.000 | 0.000 |
0.000 0.000 | 0.000 |
0.000 0.000 | 0.000 |
||
| Plot | Mito | Lyso or Perox | ER | Golgi | PM | Cytosol | Nucleus | ||||||
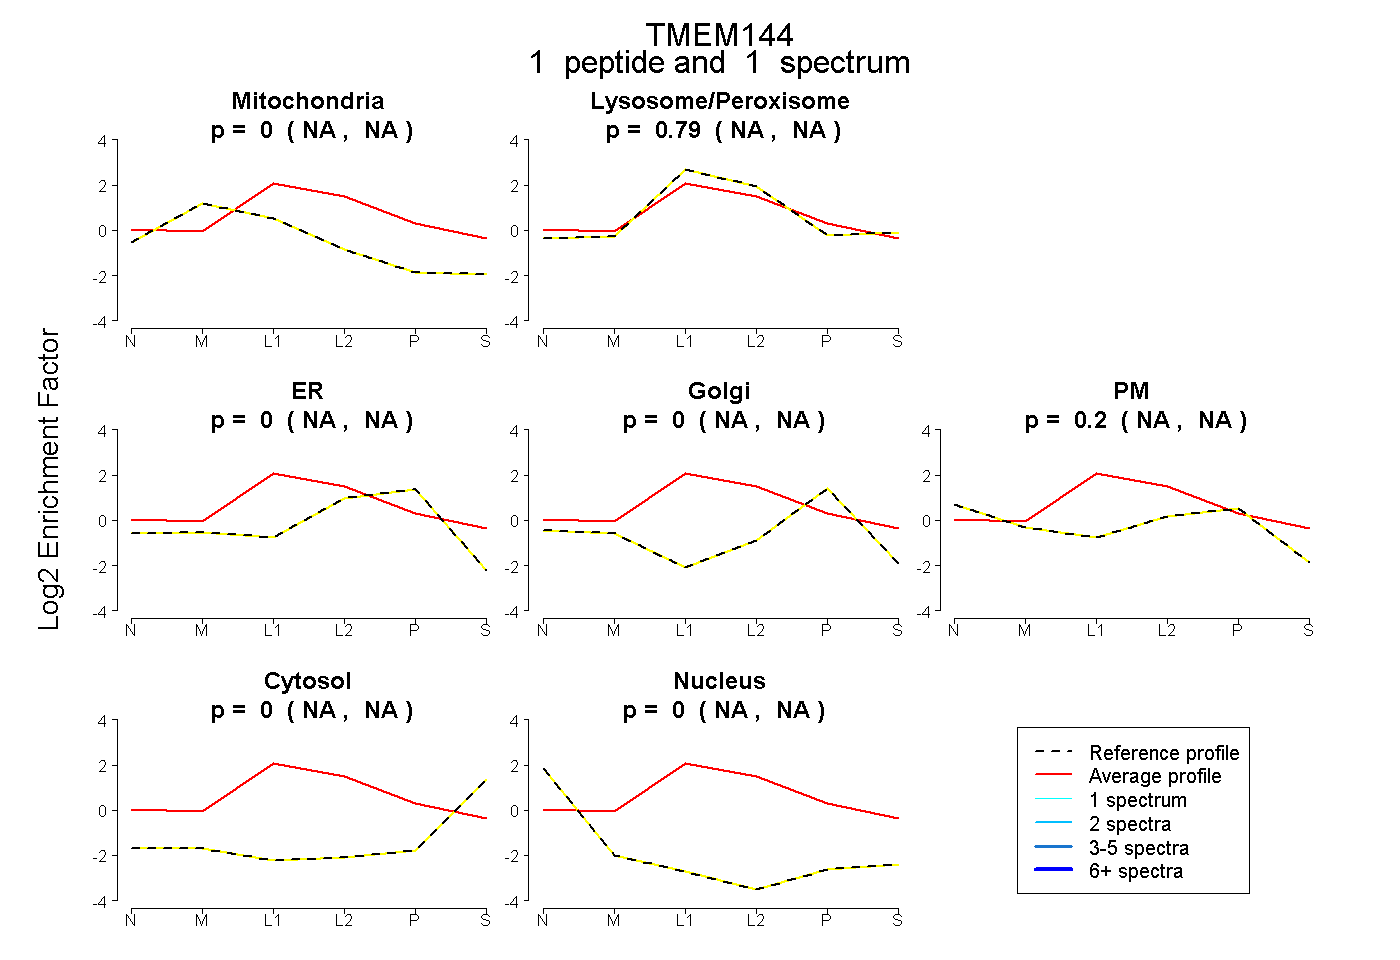
| Expt B |
1 peptide |
1 spectrum |
|
0.000 NA | NA |
0.793 NA | NA |
0.000 NA | NA |
0.002 NA | NA |
0.205 NA | NA |
0.000 NA | NA |
0.000 NA | NA |
| 1 spectrum, LSTTYR | 0.000 | 0.793 | 0.000 | 0.002 | 0.205 | 0.000 | 0.000 |
| Plot | Lyso | Other | |||||||||||
| Expt C |
2 peptides |
14 spectra |
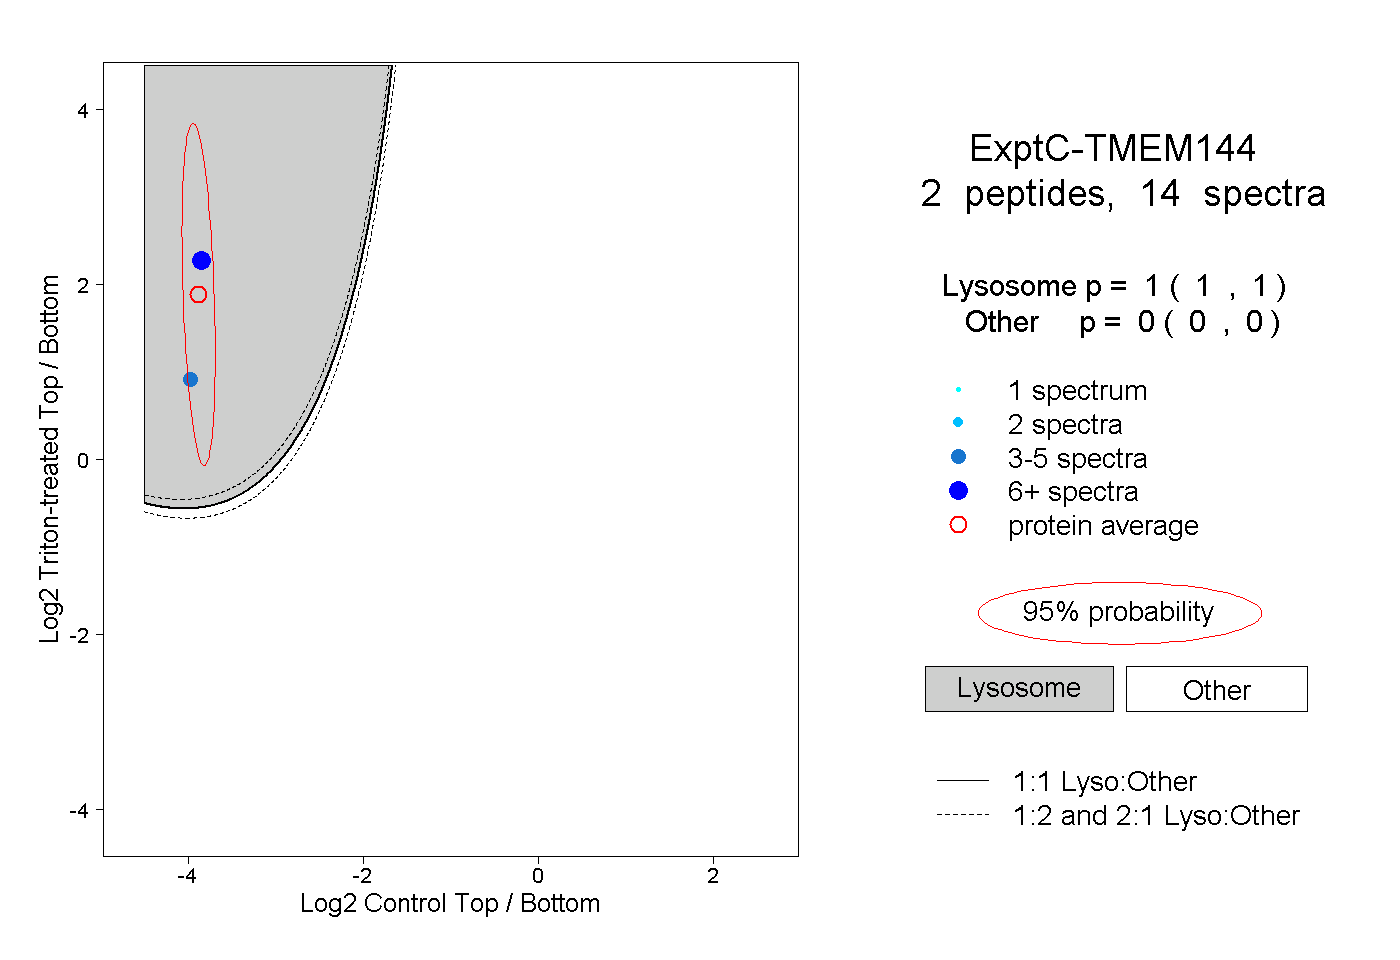 |
1.000 1.000 | 1.000 |
0.000 0.000 | 0.000 |