6
6peptides
spectra
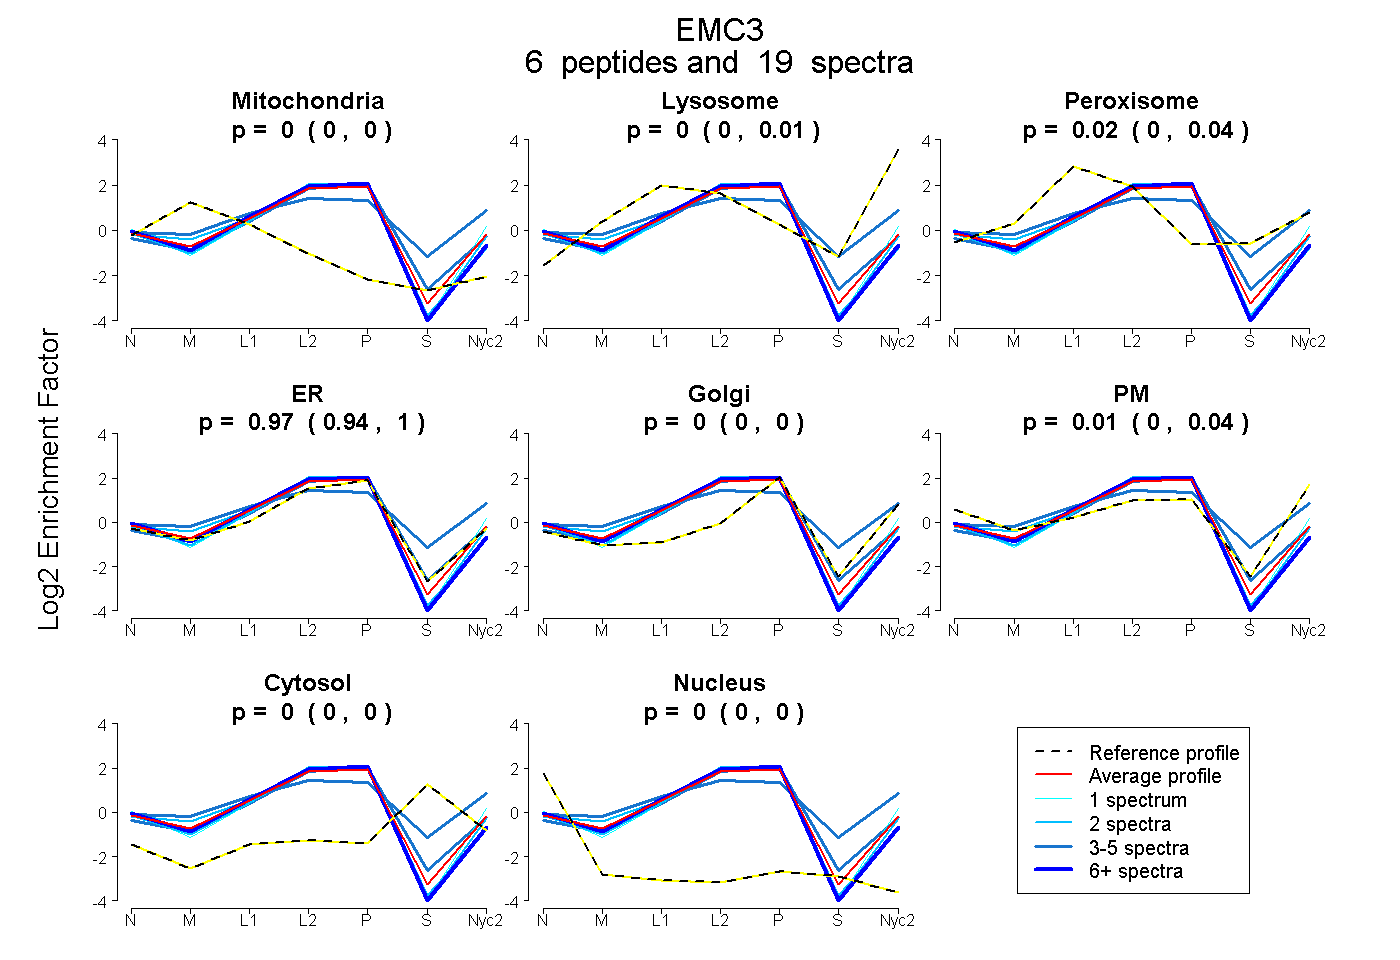
0.000 | 0.000
0.000 | 0.014
0.000 | 0.035
0.941 | 0.996
0.000 | 0.000
0.000 | 0.039
0.000 | 0.000
0.000 | 0.000
4peptides
spectra
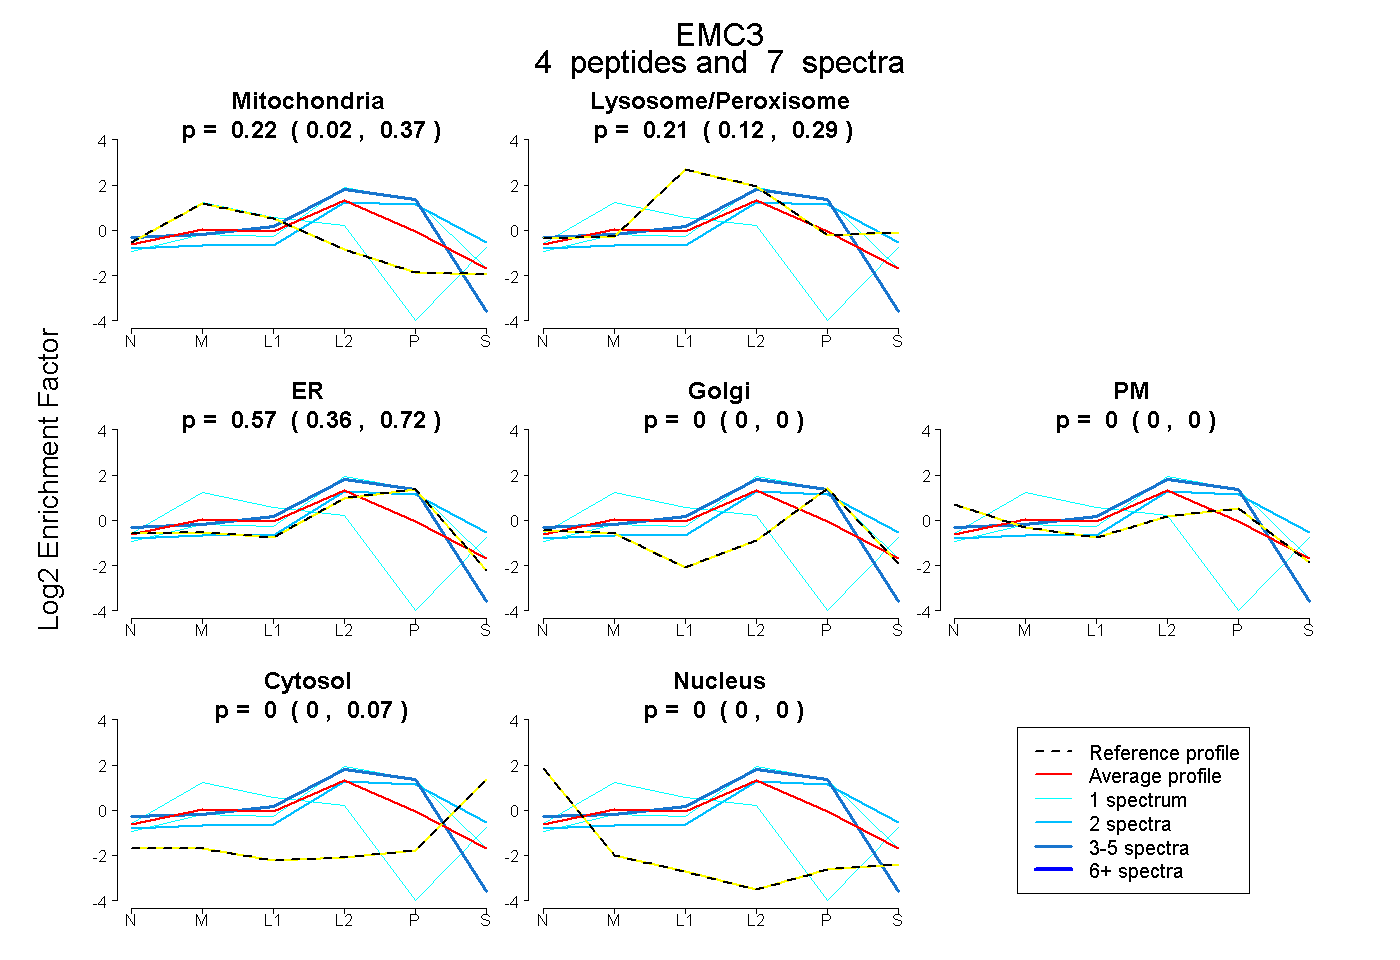
0.022 | 0.366
0.123 | 0.287
0.361 | 0.717
0.000 | 0.000
0.000 | 0.000
0.000 | 0.073
0.000 | 0.000