 6
6peptides
spectra
0.000 | 0.000
0.000 | 0.014
0.000 | 0.035
0.941 | 0.996
0.000 | 0.000
0.000 | 0.039
0.000 | 0.000
0.000 | 0.000
| Plot | Mito | Lyso | Perox | ER | Golgi | PM | Cytosol | Nucleus | |||||
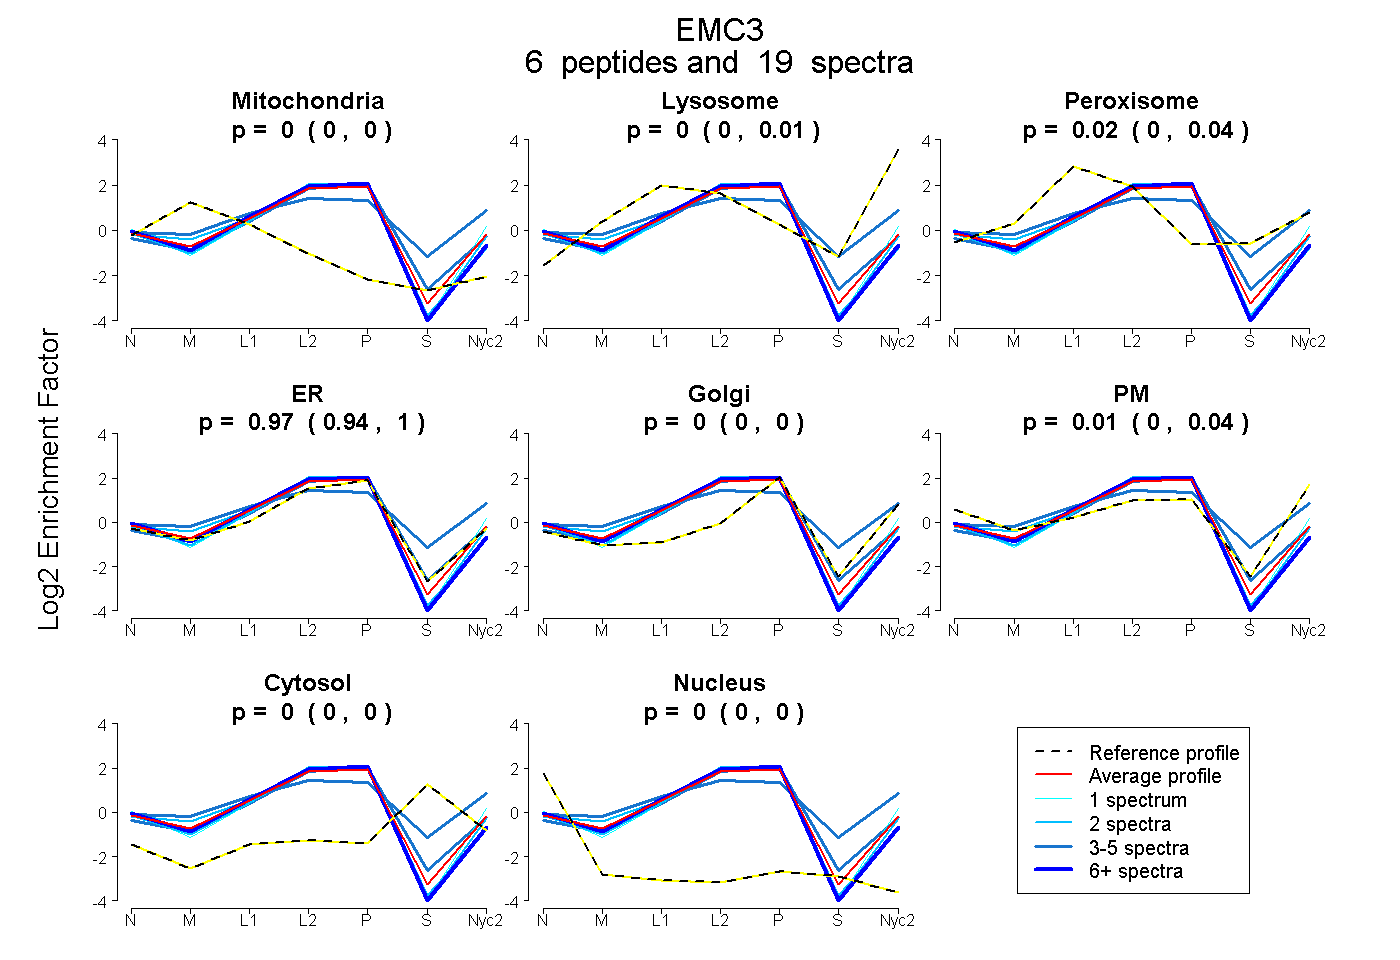
| Expt A |
6 peptides |
19 spectra |
|
0.000 0.000 | 0.000 |
0.000 0.000 | 0.014 |
0.016 0.000 | 0.035 |
0.975 0.941 | 0.996 |
0.000 0.000 | 0.000 |
0.009 0.000 | 0.039 |
0.000 0.000 | 0.000 |
0.000 0.000 | 0.000 |
| 1 spectrum, LTQEQVSDSQVLIR | 0.000 | 0.000 | 0.000 | 0.936 | 0.000 | 0.064 | 0.000 | 0.000 | ||
| 8 spectra, VPFPLTLR | 0.000 | 0.000 | 0.000 | 1.000 | 0.000 | 0.000 | 0.000 | 0.000 | ||
| 3 spectra, DLHFEGMFK | 0.000 | 0.000 | 0.037 | 0.963 | 0.000 | 0.000 | 0.000 | 0.000 | ||
| 2 spectra, SIYSLILGQDNAADQSR | 0.000 | 0.000 | 0.000 | 1.000 | 0.000 | 0.000 | 0.000 | 0.000 | ||
| 3 spectra, MMQEQMTGAAMAMPADTNK | 0.000 | 0.064 | 0.333 | 0.240 | 0.239 | 0.122 | 0.001 | 0.000 | ||
| 2 spectra, QSFLTR | 0.000 | 0.000 | 0.000 | 1.000 | 0.000 | 0.000 | 0.000 | 0.000 |
| Plot | Mito | Lyso or Perox | ER | Golgi | PM | Cytosol | Nucleus | ||||||
| Expt B |
4 peptides |
7 spectra |
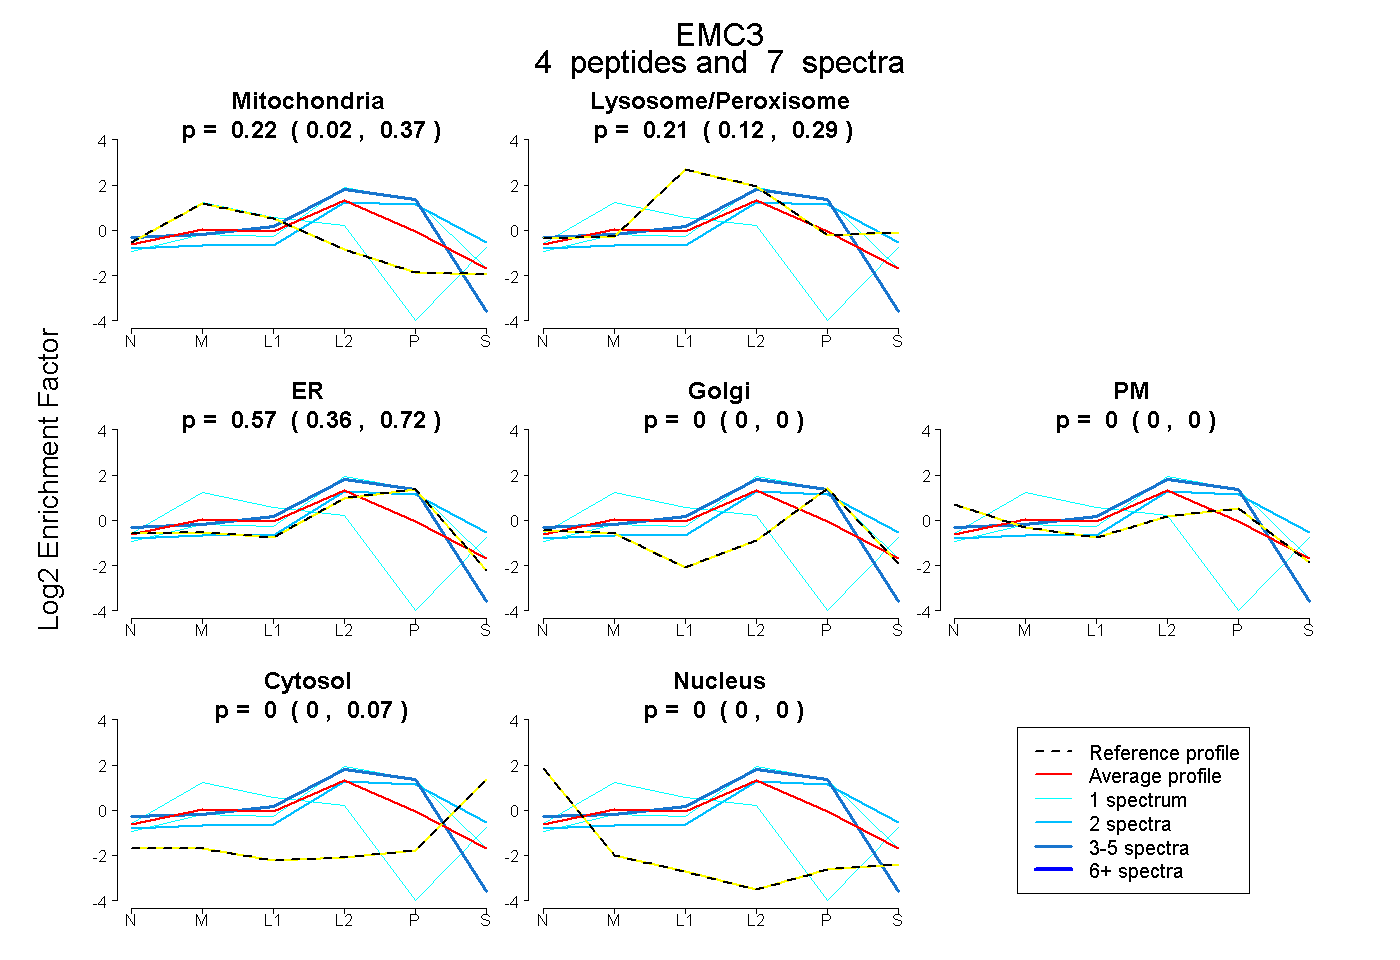 |
0.224 0.022 | 0.366 |
0.208 0.123 | 0.287 |
0.568 0.361 | 0.717 |
0.000 0.000 | 0.000 |
0.000 0.000 | 0.000 |
0.000 0.000 | 0.073 |
0.000 0.000 | 0.000 |
|||
| Plot | Lyso | Other | |||||||||||
| Expt C |
6 peptides |
14 spectra |
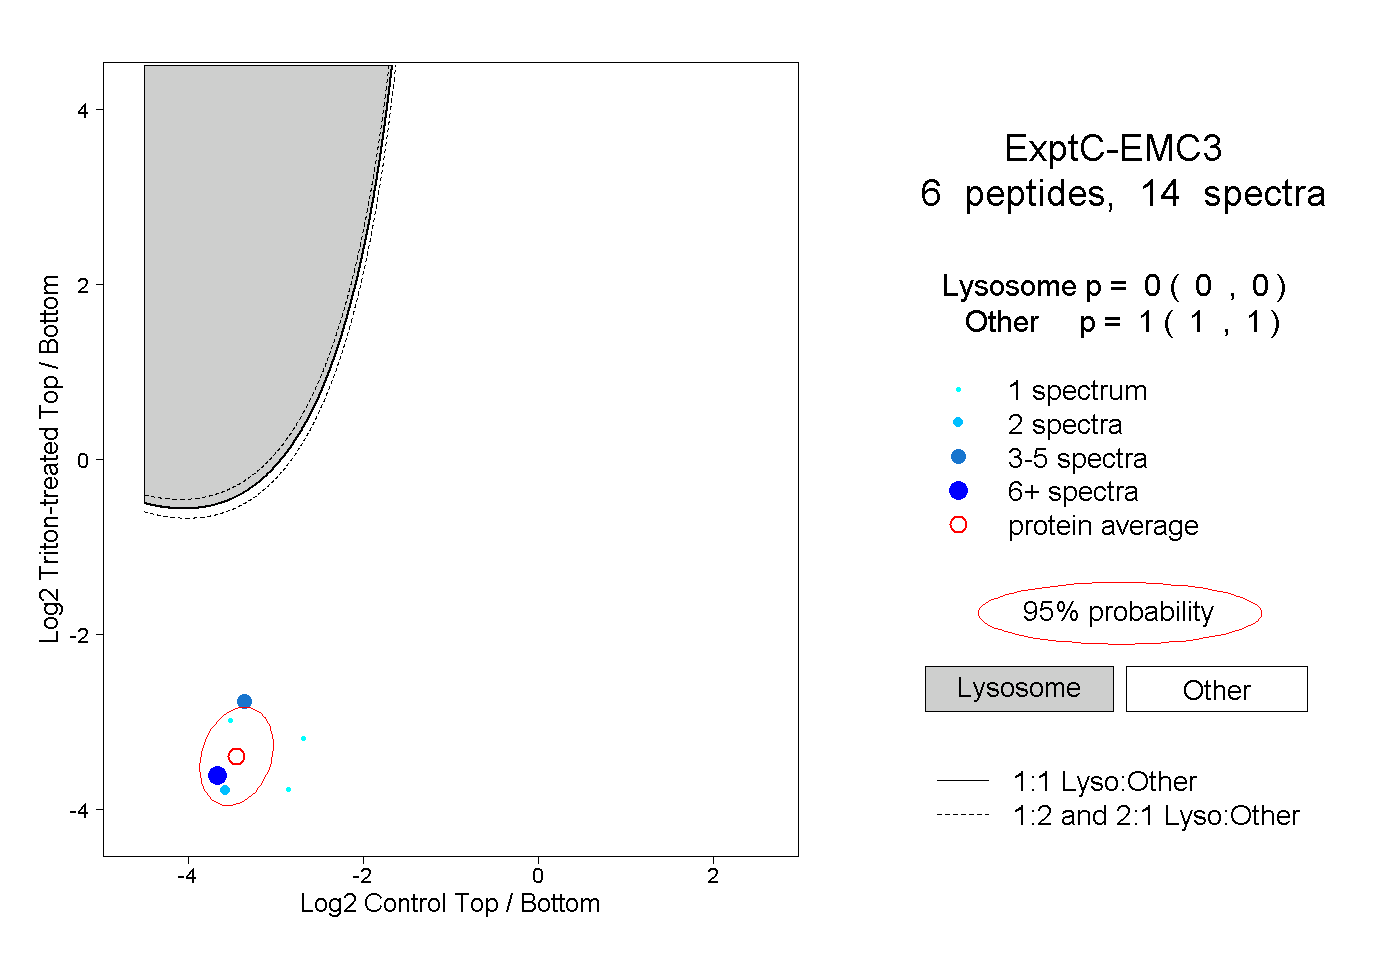 |
0.000 0.000 | 0.000 |
1.000 1.000 | 1.000 |
||||||||
| Plot | Lyso | Other | |||||||||||
| Expt D |
1 peptide |
4 spectra |
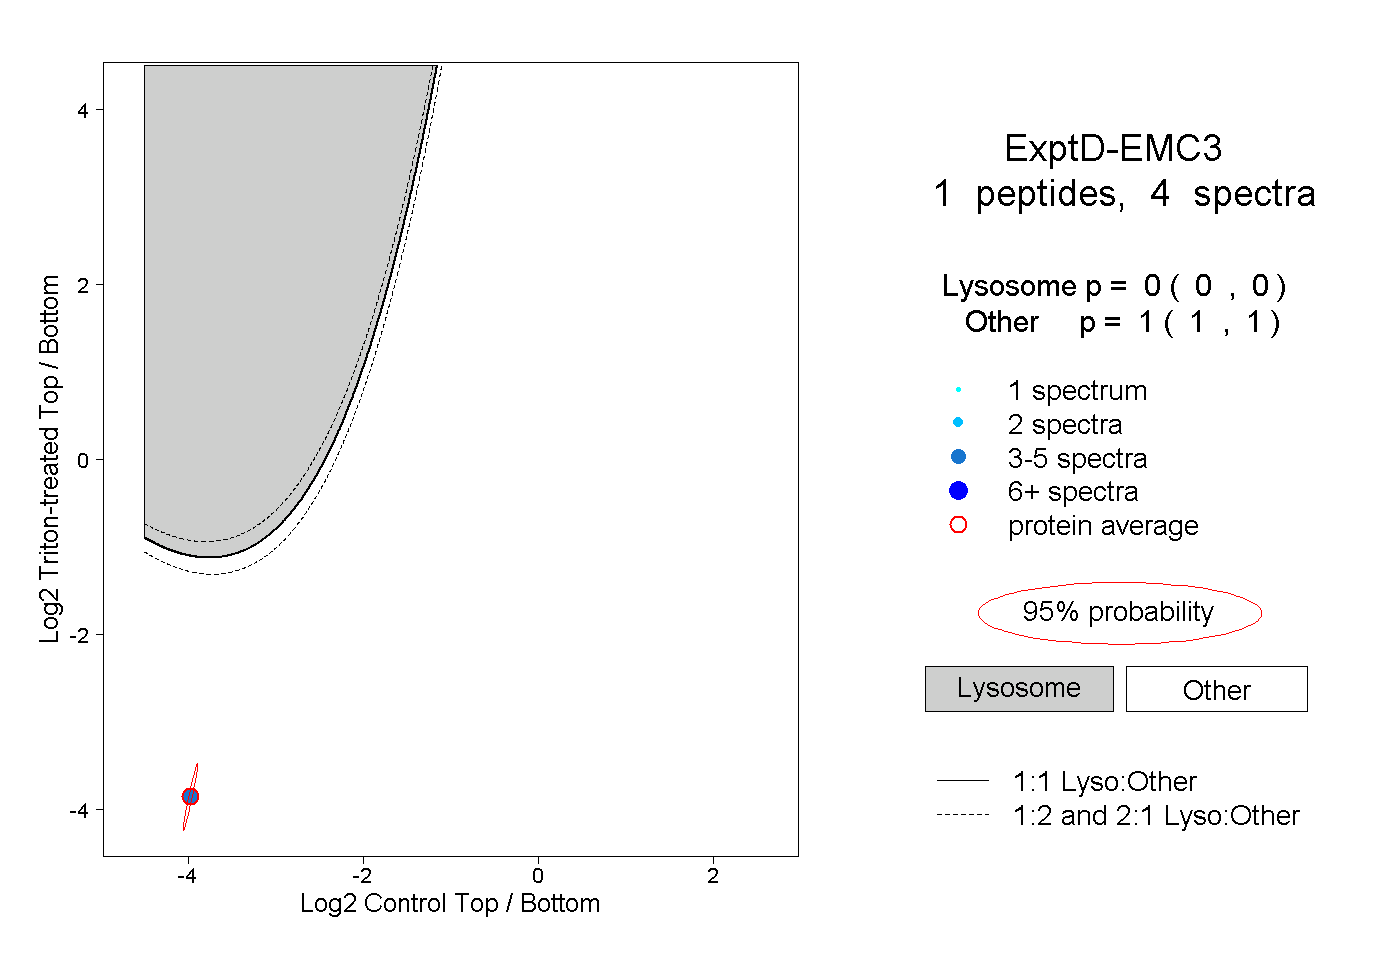 |
0.000 0.000 | 0.000 |
1.000 1.000 | 1.000 |