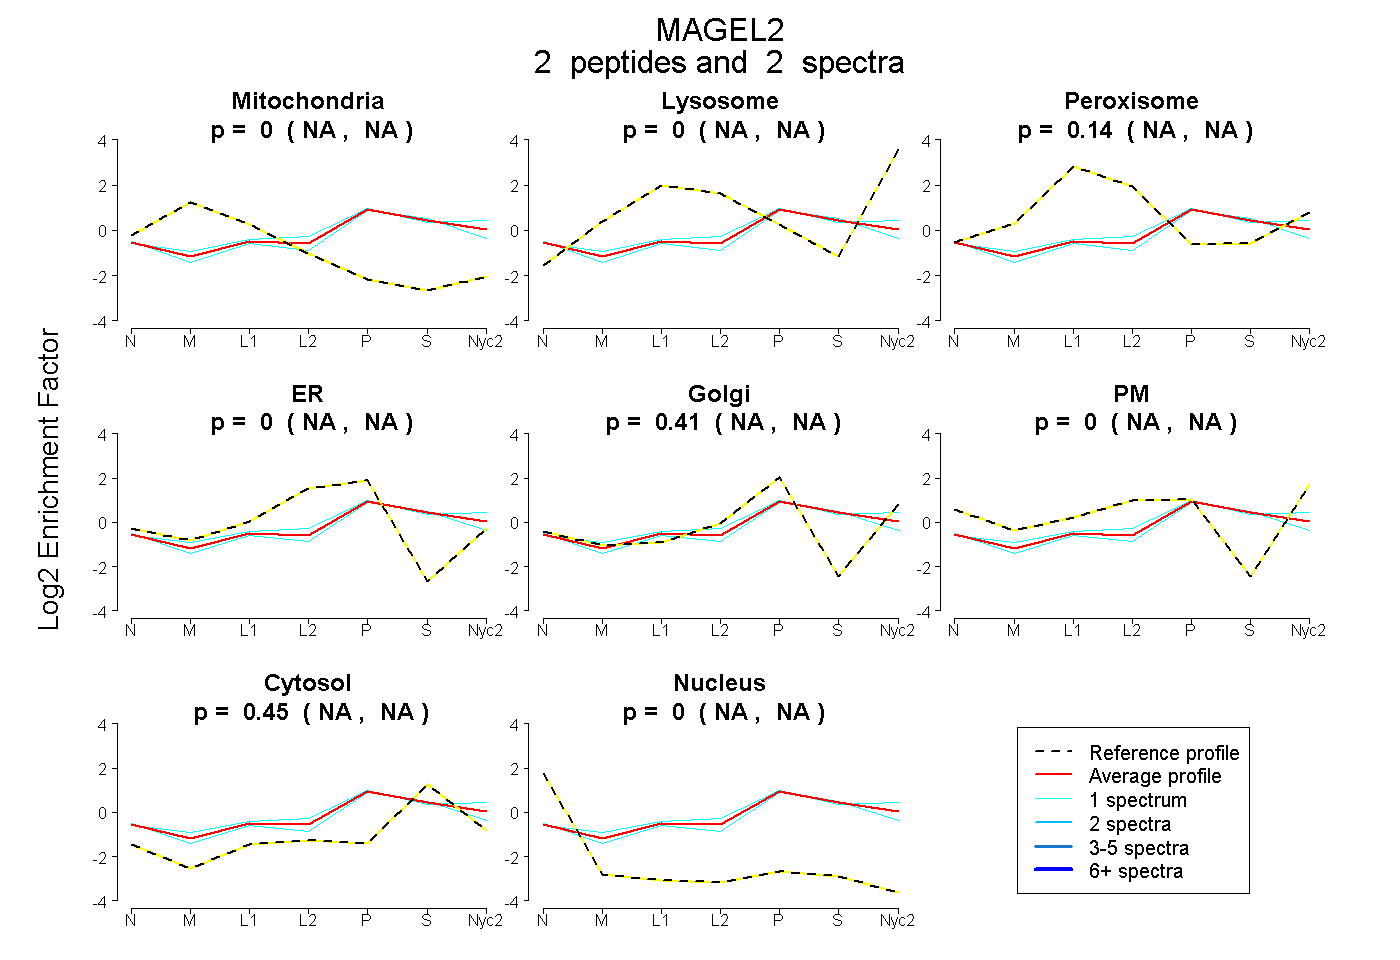
 2
2peptides
spectra
NA | NA
NA | NA
NA | NA
NA | NA
NA | NA
NA | NA
NA | NA
NA | NA
| Plot | Mito | Lyso | Perox | ER | Golgi | PM | Cytosol | Nucleus | |||||
| Expt A |
2 peptides |
2 spectra |
|
0.000 NA | NA |
0.000 NA | NA |
0.141 NA | NA |
0.000 NA | NA |
0.408 NA | NA |
0.000 NA | NA |
0.451 NA | NA |
0.000 NA | NA |
| 1 spectrum, QIPPVIR | 0.000 | 0.000 | 0.085 | 0.000 | 0.393 | 0.000 | 0.522 | 0.000 | ||
| 1 spectrum, GAPASK | 0.000 | 0.094 | 0.118 | 0.000 | 0.390 | 0.000 | 0.398 | 0.000 |
| Plot | Lyso | Other | |||||||||||
| Expt C |
1 peptide |
1 spectrum |
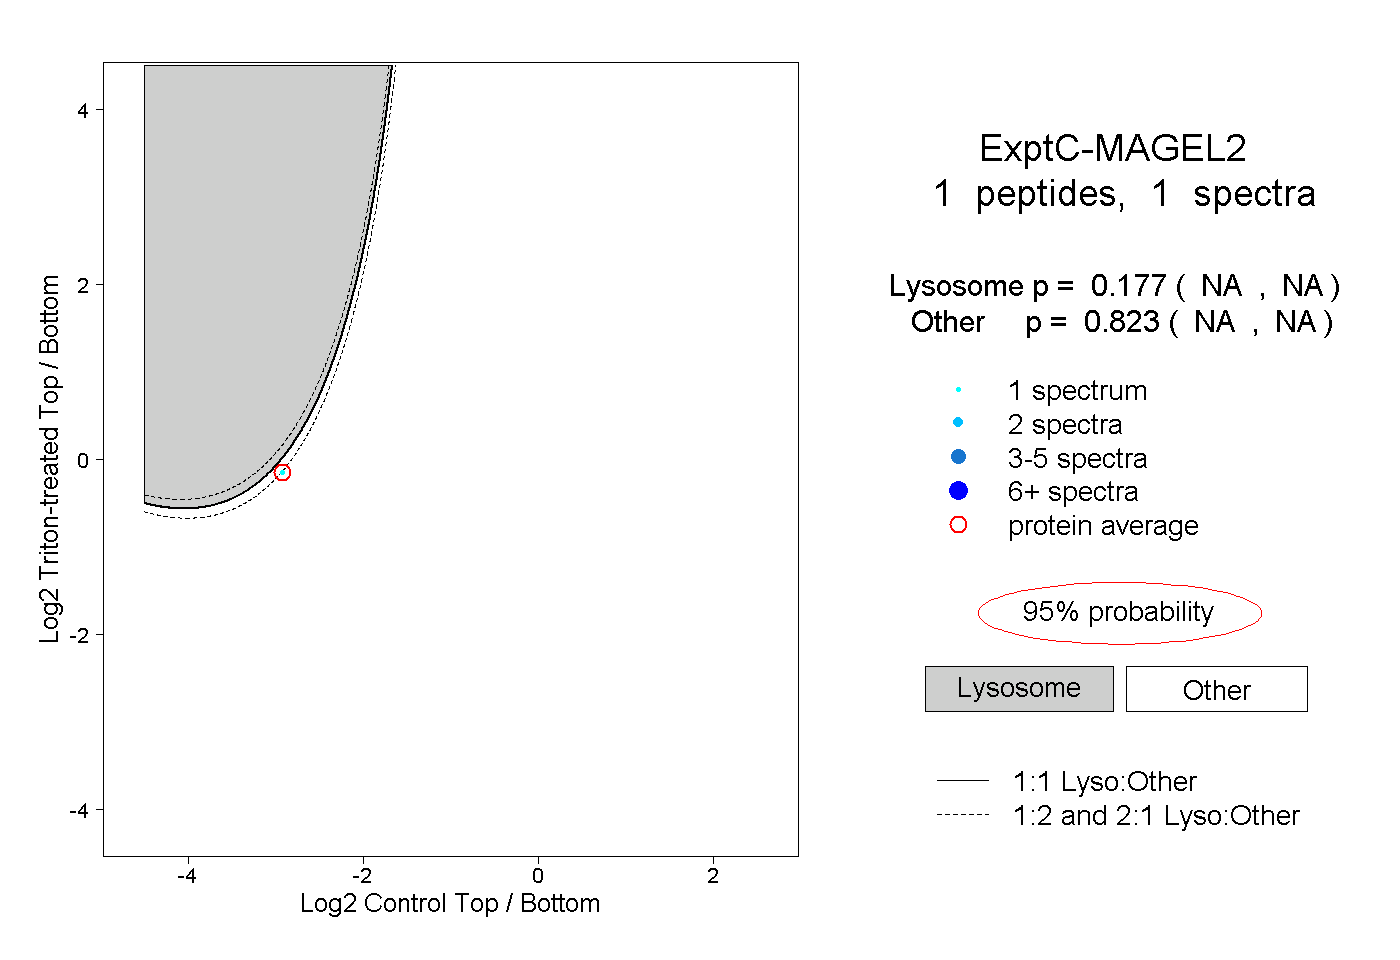 |
0.177 NA | NA |
0.823 NA | NA |