 24
24peptides
spectra
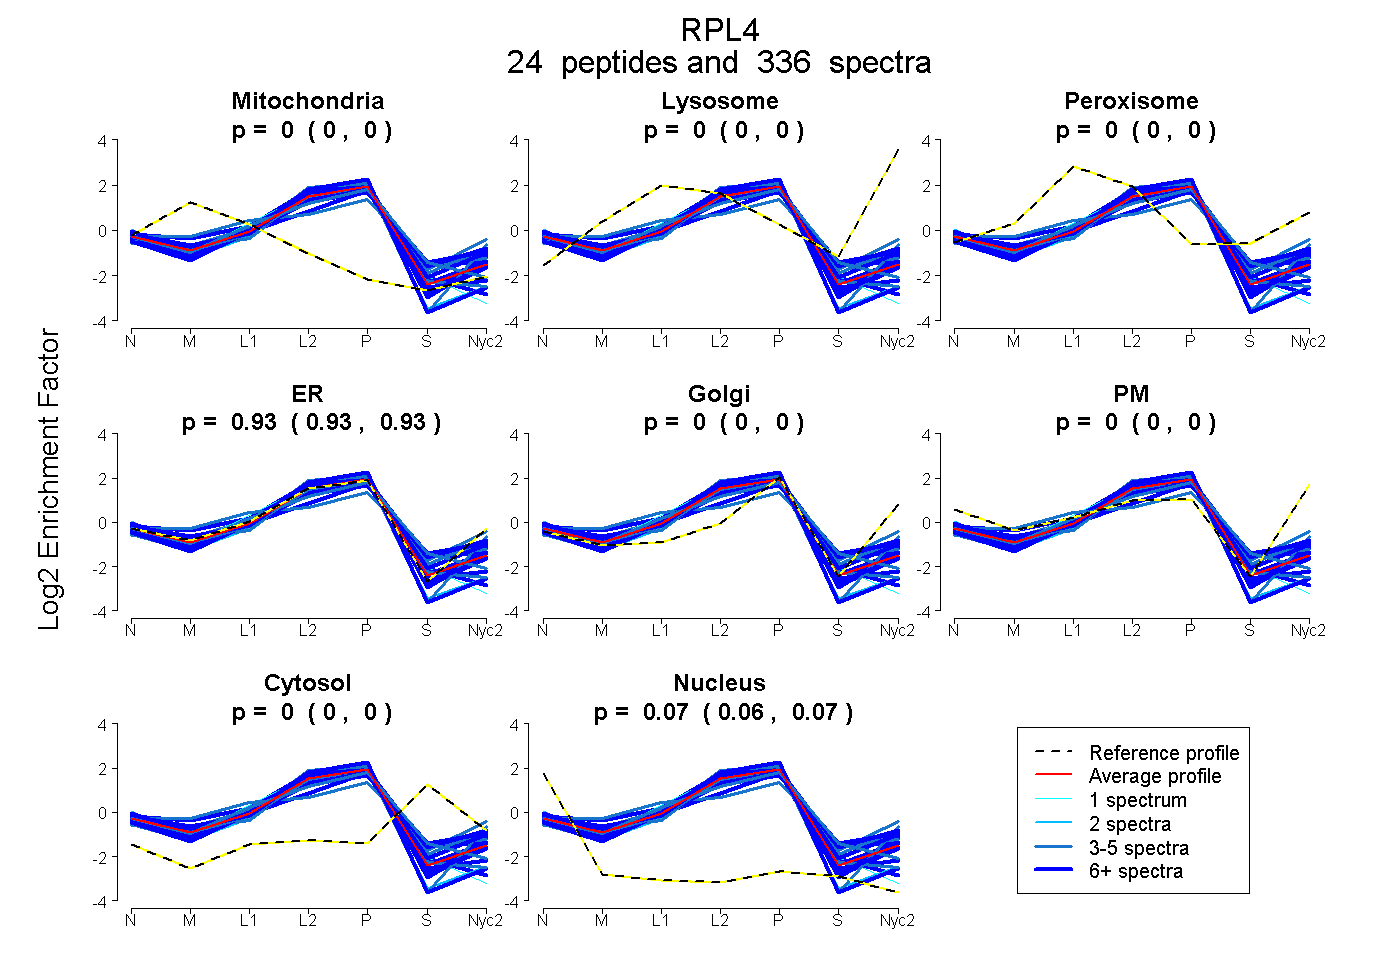
0.000 | 0.000
0.000 | 0.000
0.000 | 0.000
0.933 | 0.935
0.000 | 0.000
0.000 | 0.000
0.000 | 0.000
0.065 | 0.067
17peptides
spectra
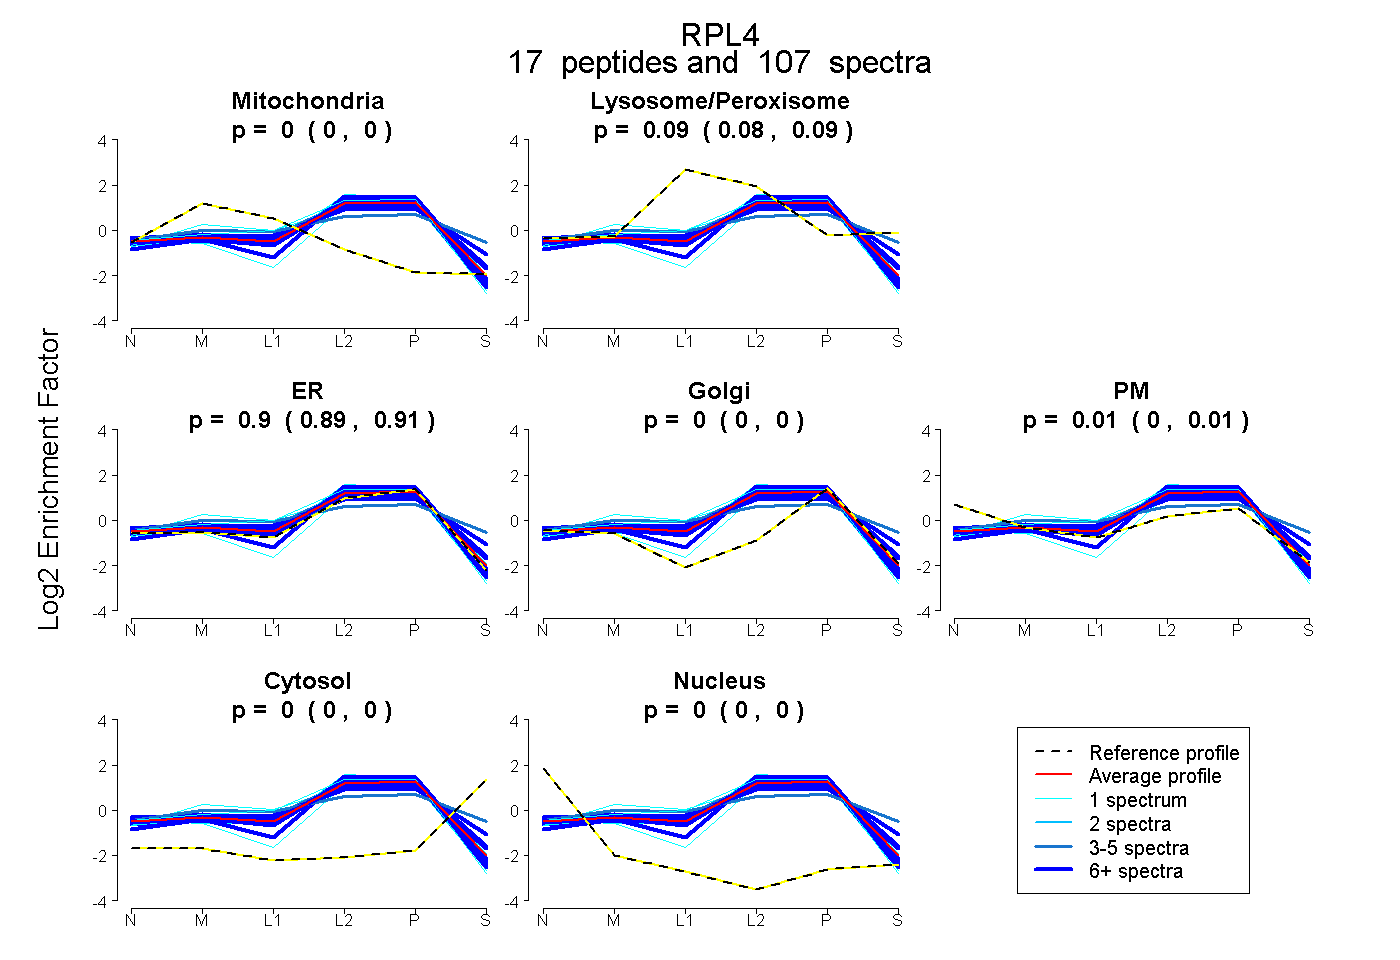
0.000 | 0.000
0.085 | 0.093
0.894 | 0.907
0.000 | 0.000
0.005 | 0.014
0.000 | 0.000
0.000 | 0.000
25peptides
spectra
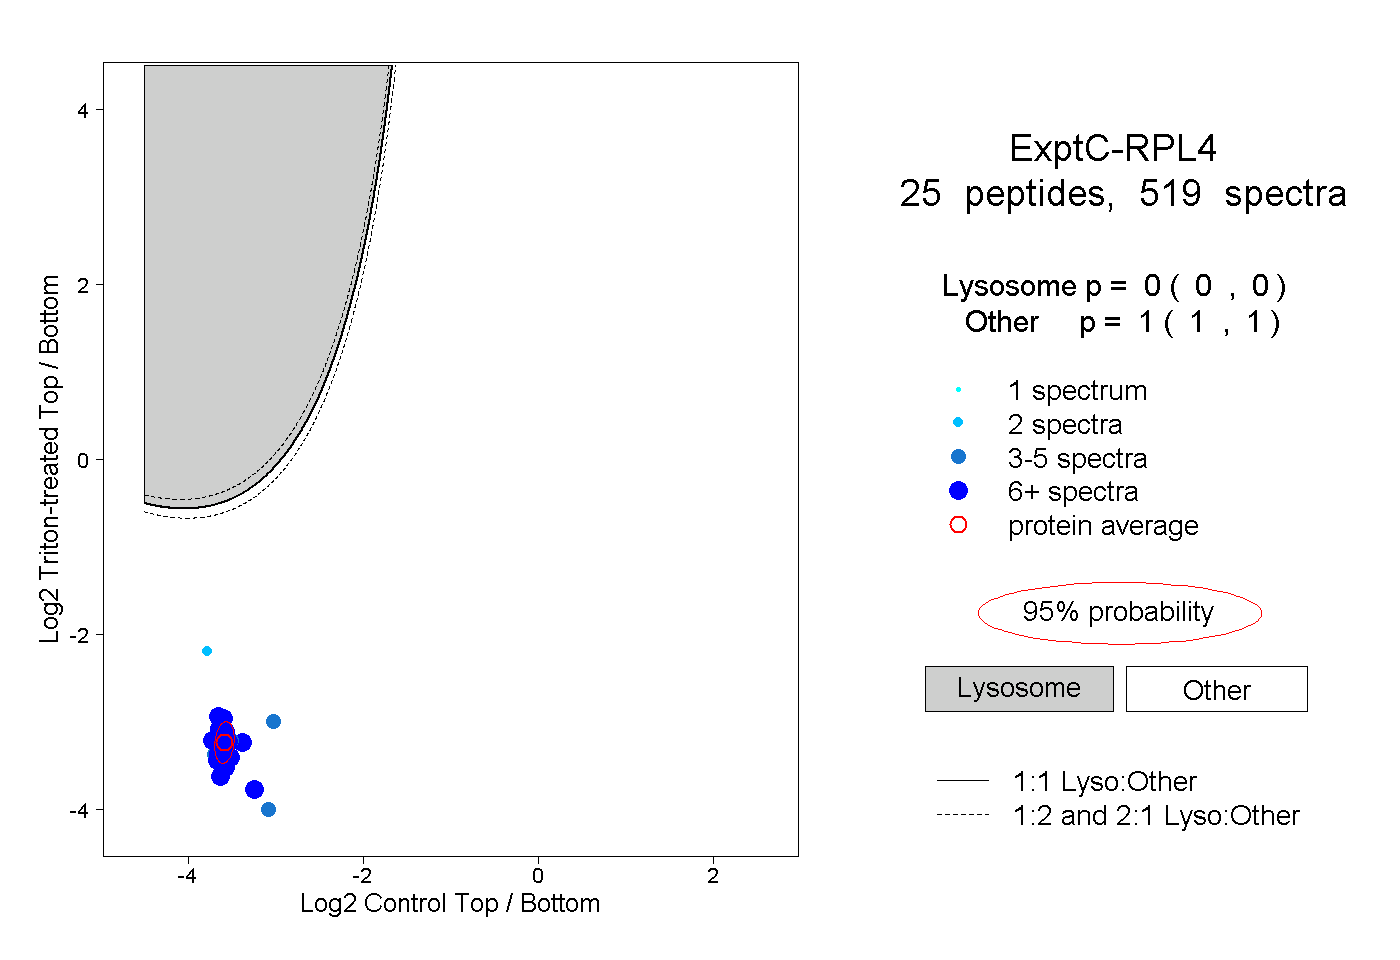
0.000 | 0.000
1.000 | 1.000
14peptides
spectra
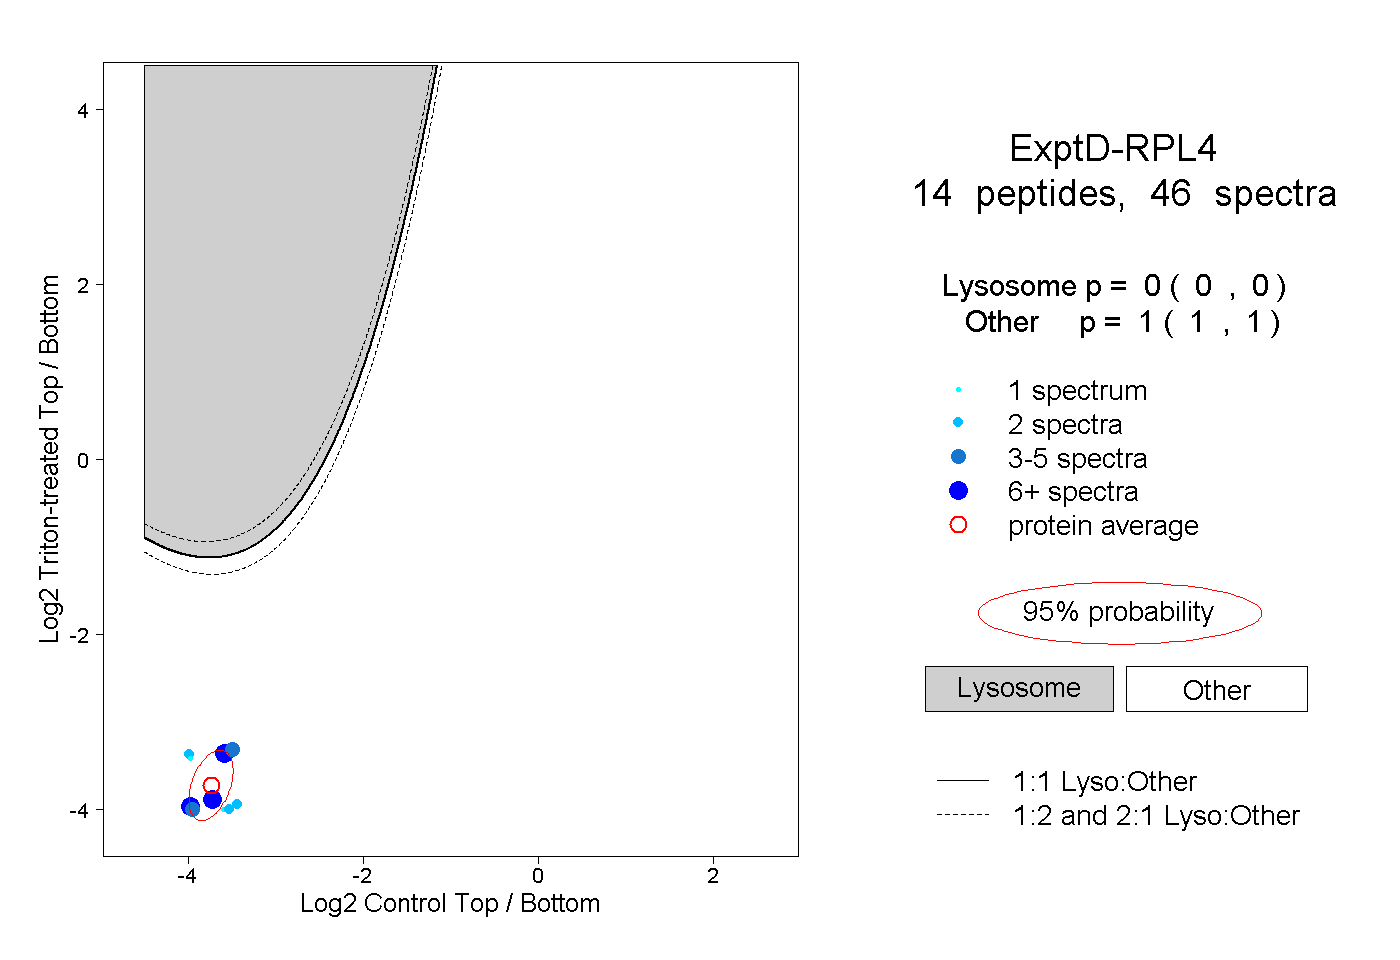
0.000 | 0.000
1.000 | 1.000