 24
24peptides
spectra
0.000 | 0.000
0.000 | 0.000
0.000 | 0.000
0.933 | 0.935
0.000 | 0.000
0.000 | 0.000
0.000 | 0.000
0.065 | 0.067
| Plot | Mito | Lyso | Perox | ER | Golgi | PM | Cytosol | Nucleus | |||||
| Expt A |
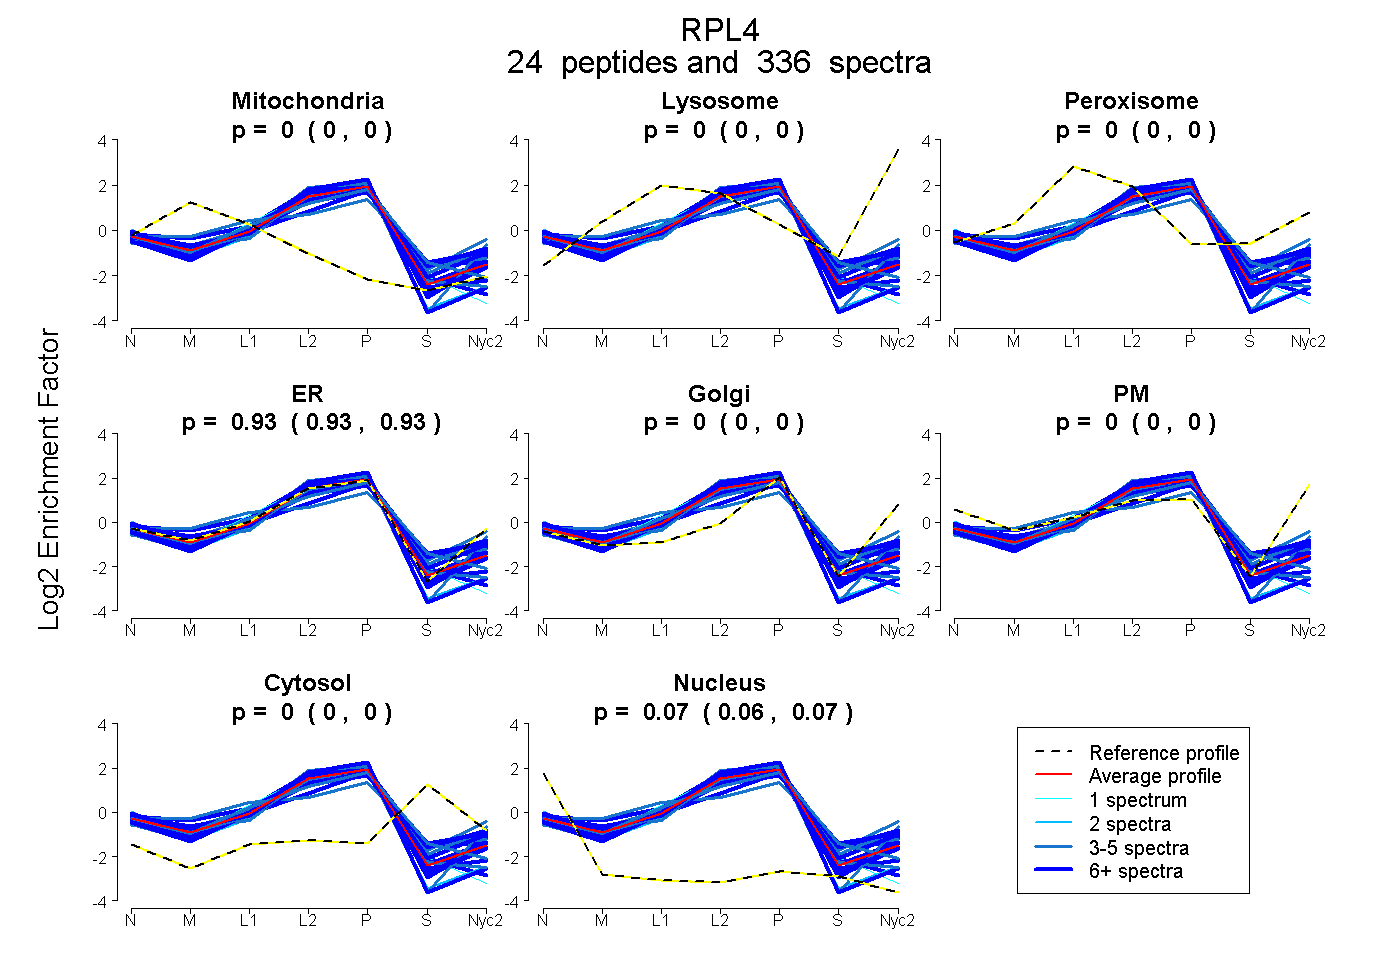
24 peptides |
336 spectra |
|
0.000 0.000 | 0.000 |
0.000 0.000 | 0.000 |
0.000 0.000 | 0.000 |
0.934 0.933 | 0.935 |
0.000 0.000 | 0.000 |
0.000 0.000 | 0.000 |
0.000 0.000 | 0.000 |
0.066 0.065 | 0.067 |
| 24 spectra, SNYNLPMHK | 0.000 | 0.000 | 0.021 | 0.815 | 0.000 | 0.000 | 0.164 | 0.000 | ||
| 6 spectra, NIPGITLLNVSK | 0.000 | 0.000 | 0.000 | 0.946 | 0.000 | 0.000 | 0.000 | 0.054 | ||
| 17 spectra, MFAPTK | 0.000 | 0.000 | 0.000 | 0.964 | 0.000 | 0.000 | 0.000 | 0.036 | ||
| 5 spectra, NVTLPAVFK | 0.000 | 0.000 | 0.000 | 1.000 | 0.000 | 0.000 | 0.000 | 0.000 | ||
| 19 spectra, LNPYAK | 0.000 | 0.000 | 0.000 | 0.925 | 0.000 | 0.000 | 0.000 | 0.075 | ||
| 6 spectra, APIRPDIVNFVHTNLR | 0.038 | 0.000 | 0.000 | 0.858 | 0.000 | 0.000 | 0.000 | 0.104 | ||
| 37 spectra, LAPGGHVGR | 0.000 | 0.000 | 0.000 | 0.922 | 0.000 | 0.000 | 0.000 | 0.078 | ||
| 4 spectra, YAICSALAASALPALVMSK | 0.025 | 0.000 | 0.000 | 0.804 | 0.000 | 0.000 | 0.142 | 0.029 | ||
| 2 spectra, GGGTHR | 0.000 | 0.000 | 0.000 | 0.863 | 0.000 | 0.000 | 0.000 | 0.137 | ||
| 12 spectra, VNTTQK | 0.020 | 0.000 | 0.000 | 0.924 | 0.000 | 0.000 | 0.000 | 0.055 | ||
| 7 spectra, KPAVGK | 0.000 | 0.000 | 0.000 | 0.803 | 0.000 | 0.000 | 0.149 | 0.048 | ||
| 17 spectra, FCIWTESAFR | 0.000 | 0.000 | 0.000 | 0.902 | 0.000 | 0.000 | 0.000 | 0.098 | ||
| 27 spectra, SPEIQR | 0.000 | 0.000 | 0.000 | 0.867 | 0.000 | 0.000 | 0.133 | 0.000 | ||
| 56 spectra, MMNTDLSR | 0.000 | 0.000 | 0.000 | 0.978 | 0.000 | 0.000 | 0.000 | 0.022 | ||
| 25 spectra, VYASQR | 0.001 | 0.000 | 0.000 | 0.941 | 0.000 | 0.000 | 0.058 | 0.000 | ||
| 6 spectra, EAVQLLK | 0.076 | 0.000 | 0.000 | 0.924 | 0.000 | 0.000 | 0.000 | 0.000 | ||
| 3 spectra, LEAAAAALAAK | 0.000 | 0.000 | 0.057 | 0.845 | 0.000 | 0.000 | 0.098 | 0.000 | ||
| 5 spectra, LDELYGTWR | 0.000 | 0.000 | 0.000 | 0.912 | 0.000 | 0.000 | 0.088 | 0.000 | ||
| 4 spectra, AWNDIK | 0.000 | 0.000 | 0.000 | 0.934 | 0.000 | 0.000 | 0.000 | 0.066 | ||
| 4 spectra, GESSGK | 0.037 | 0.000 | 0.011 | 0.900 | 0.000 | 0.000 | 0.053 | 0.000 | ||
| 5 spectra, VEEVPELPLVVEDK | 0.000 | 0.000 | 0.000 | 0.881 | 0.000 | 0.000 | 0.000 | 0.119 | ||
| 1 spectrum, GPCIIYNEDNGIIK | 0.035 | 0.000 | 0.000 | 0.870 | 0.000 | 0.000 | 0.000 | 0.095 | ||
| 40 spectra, SGQGAFGNMCR | 0.000 | 0.000 | 0.000 | 0.914 | 0.000 | 0.000 | 0.000 | 0.086 | ||
| 4 spectra, QPYAVSELAGHQTSAESWGTGR | 0.155 | 0.000 | 0.076 | 0.665 | 0.000 | 0.000 | 0.105 | 0.000 |
| Plot | Mito | Lyso or Perox | ER | Golgi | PM | Cytosol | Nucleus | ||||||
| Expt B |
17 peptides |
107 spectra |
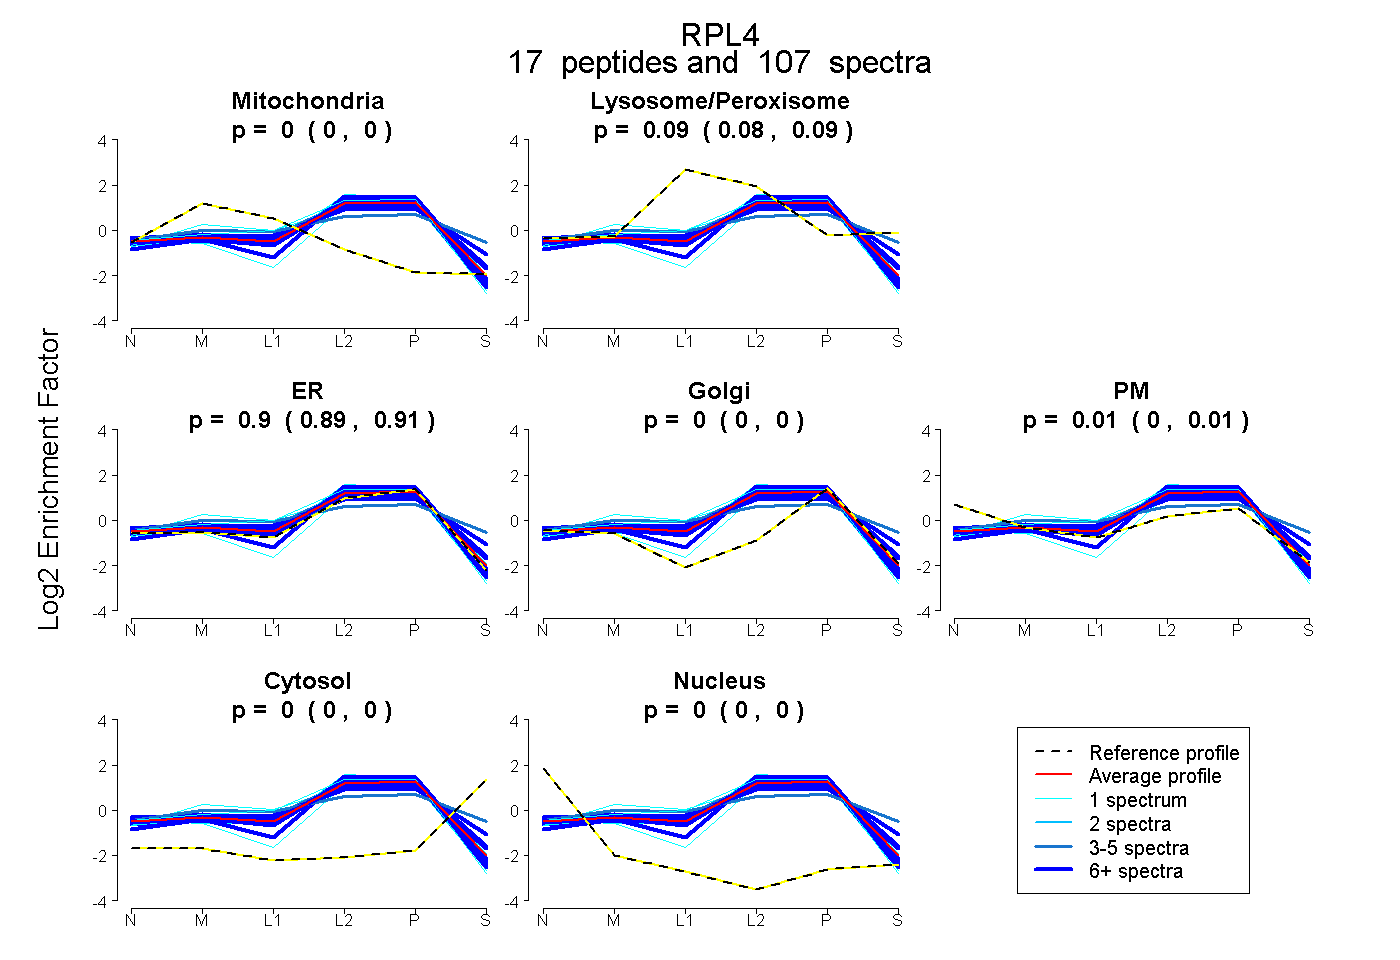 |
0.000 0.000 | 0.000 |
0.089 0.085 | 0.093 |
0.901 0.894 | 0.907 |
0.000 0.000 | 0.000 |
0.010 0.005 | 0.014 |
0.000 0.000 | 0.000 |
0.000 0.000 | 0.000 |
|||
| Plot | Lyso | Other | |||||||||||
| Expt C |
25 peptides |
519 spectra |
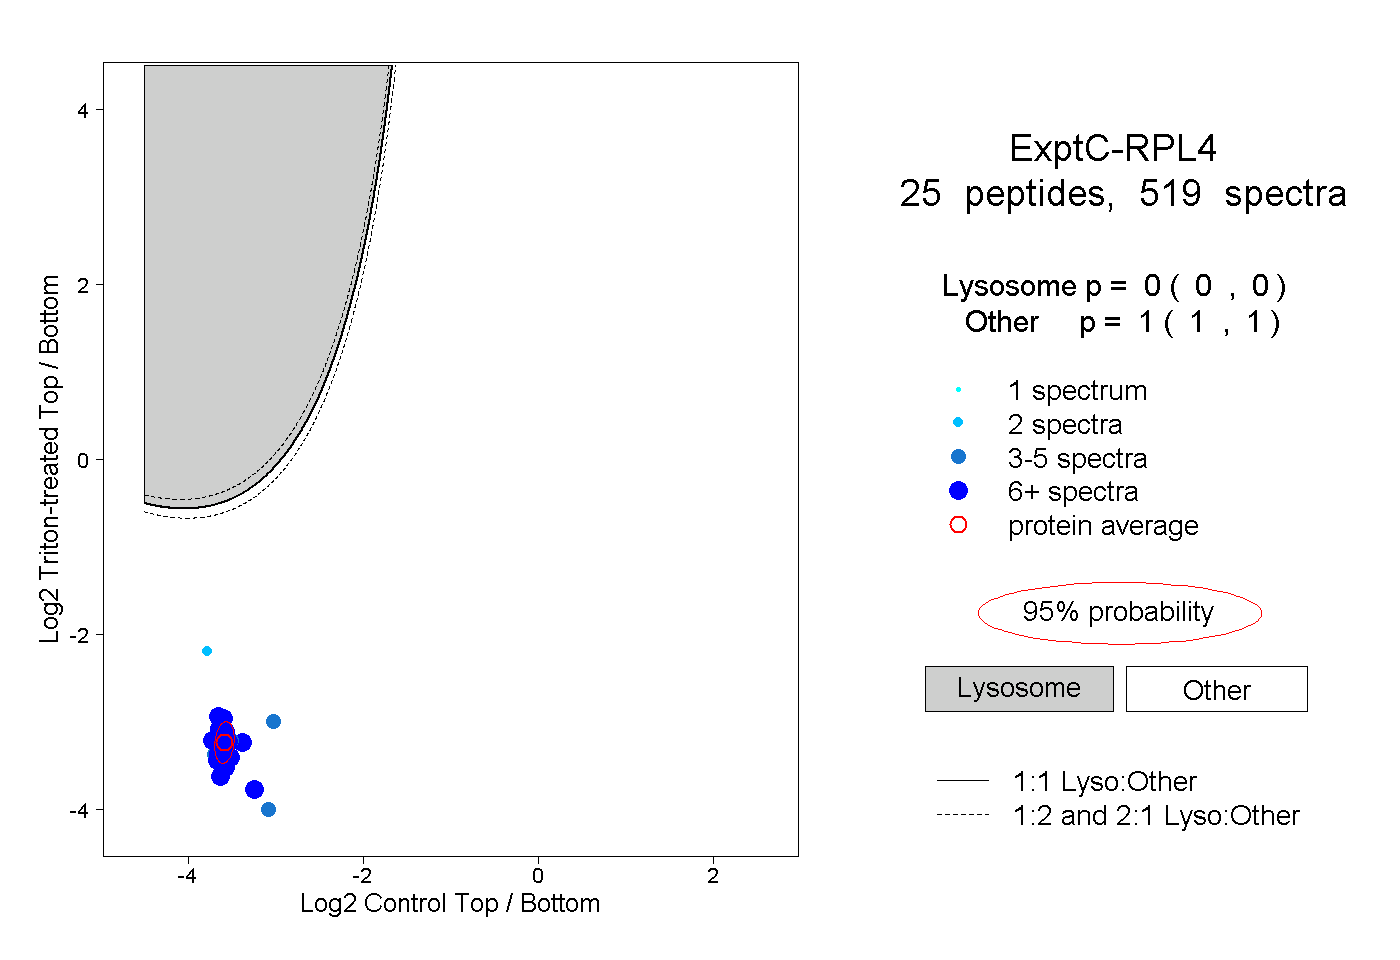 |
0.000 0.000 | 0.000 |
1.000 1.000 | 1.000 |
||||||||
| Plot | Lyso | Other | |||||||||||
| Expt D |
14 peptides |
46 spectra |
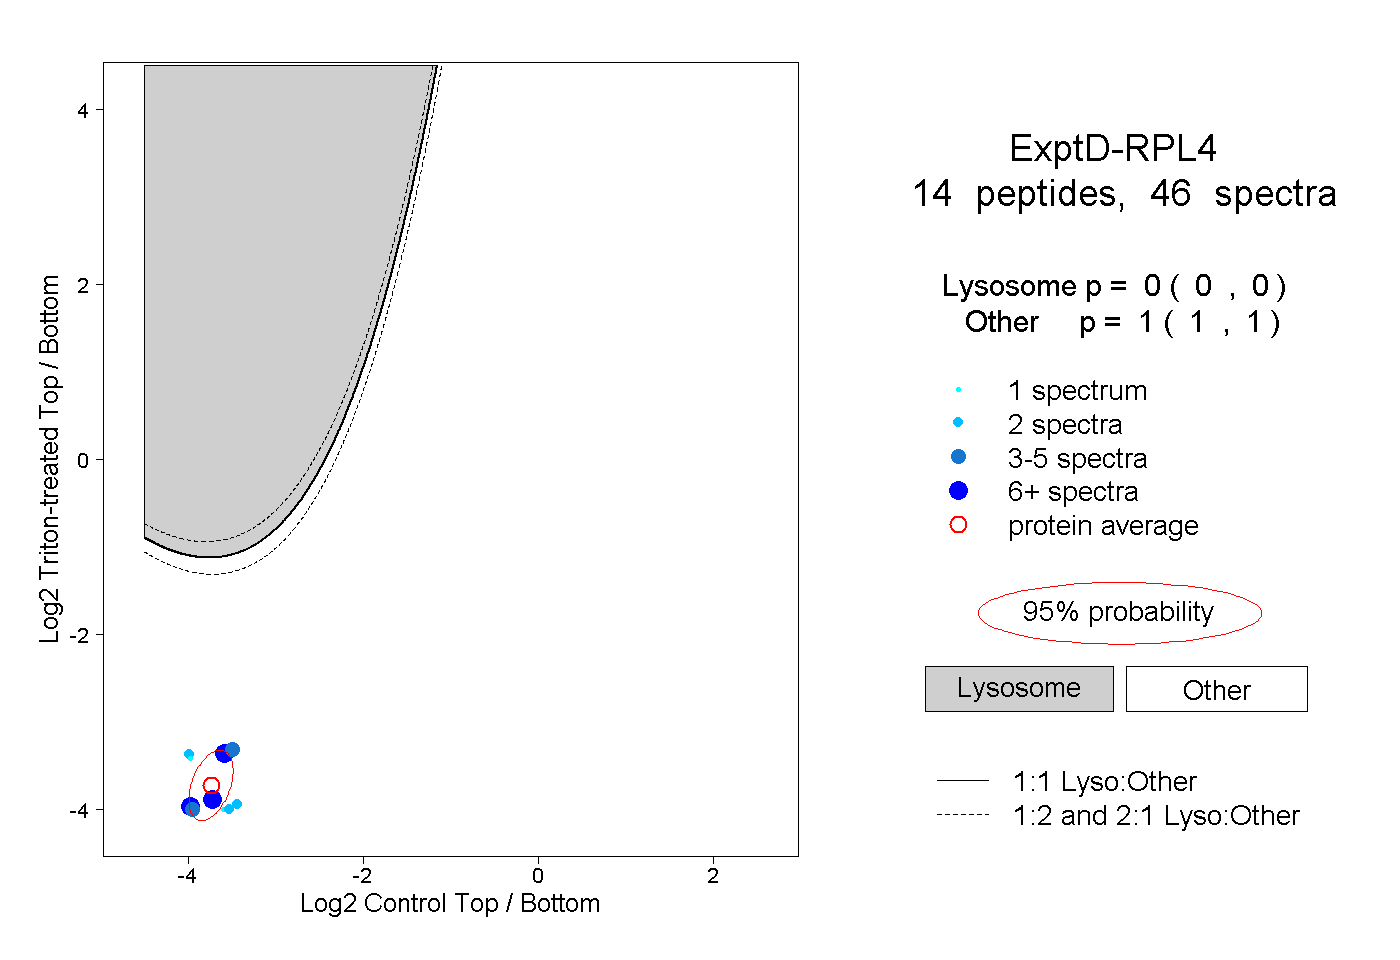 |
0.000 0.000 | 0.000 |
1.000 1.000 | 1.000 |