 3
3peptides
spectra
0.000 | 0.000
0.000 | 0.000
0.000 | 0.012
0.041 | 0.206
0.000 | 0.137
0.173 | 0.335
0.251 | 0.324
0.222 | 0.268
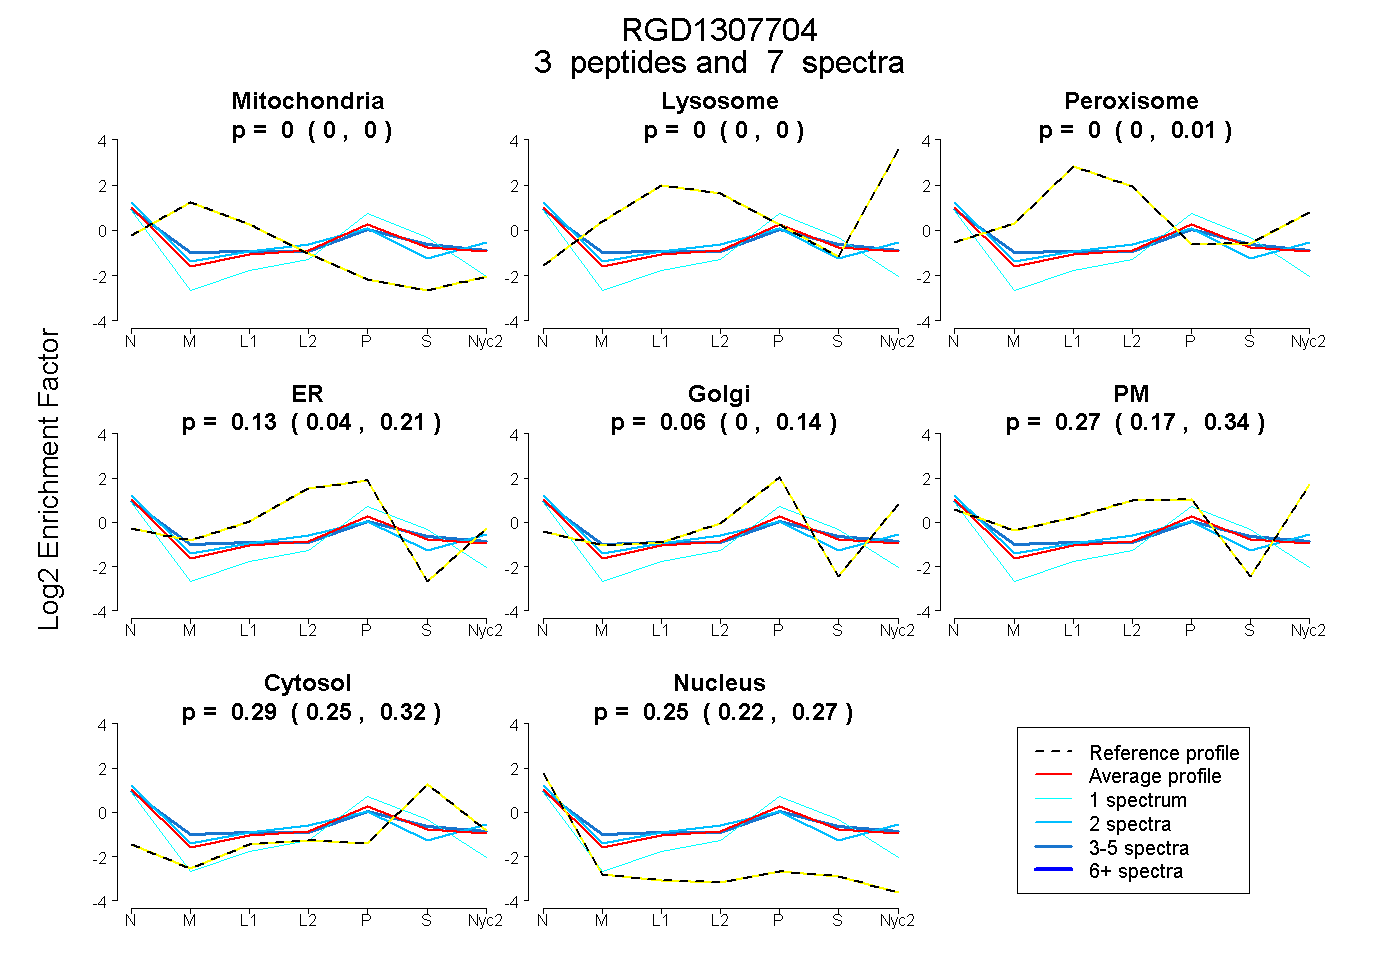
| Plot | Mito | Lyso | Perox | ER | Golgi | PM | Cytosol | Nucleus | |||||
| Expt A |
3 peptides |
7 spectra |
|
0.000 0.000 | 0.000 |
0.000 0.000 | 0.000 |
0.000 0.000 | 0.012 |
0.130 0.041 | 0.206 |
0.061 0.000 | 0.137 |
0.270 0.173 | 0.335 |
0.293 0.251 | 0.324 |
0.246 0.222 | 0.268 |
| 4 spectra, ALSVHGLPIR | 0.003 | 0.000 | 0.101 | 0.000 | 0.117 | 0.267 | 0.262 | 0.250 | ||
| 2 spectra, LGHFAPVDAVADQR | 0.000 | 0.000 | 0.000 | 0.036 | 0.000 | 0.497 | 0.197 | 0.270 | ||
| 1 spectrum, ERPAELPEASR | 0.000 | 0.000 | 0.000 | 0.177 | 0.154 | 0.000 | 0.360 | 0.310 |
| Plot | Mito | Lyso or Perox | ER | Golgi | PM | Cytosol | Nucleus | ||||||
| Expt B |
1 peptide |
2 spectra |
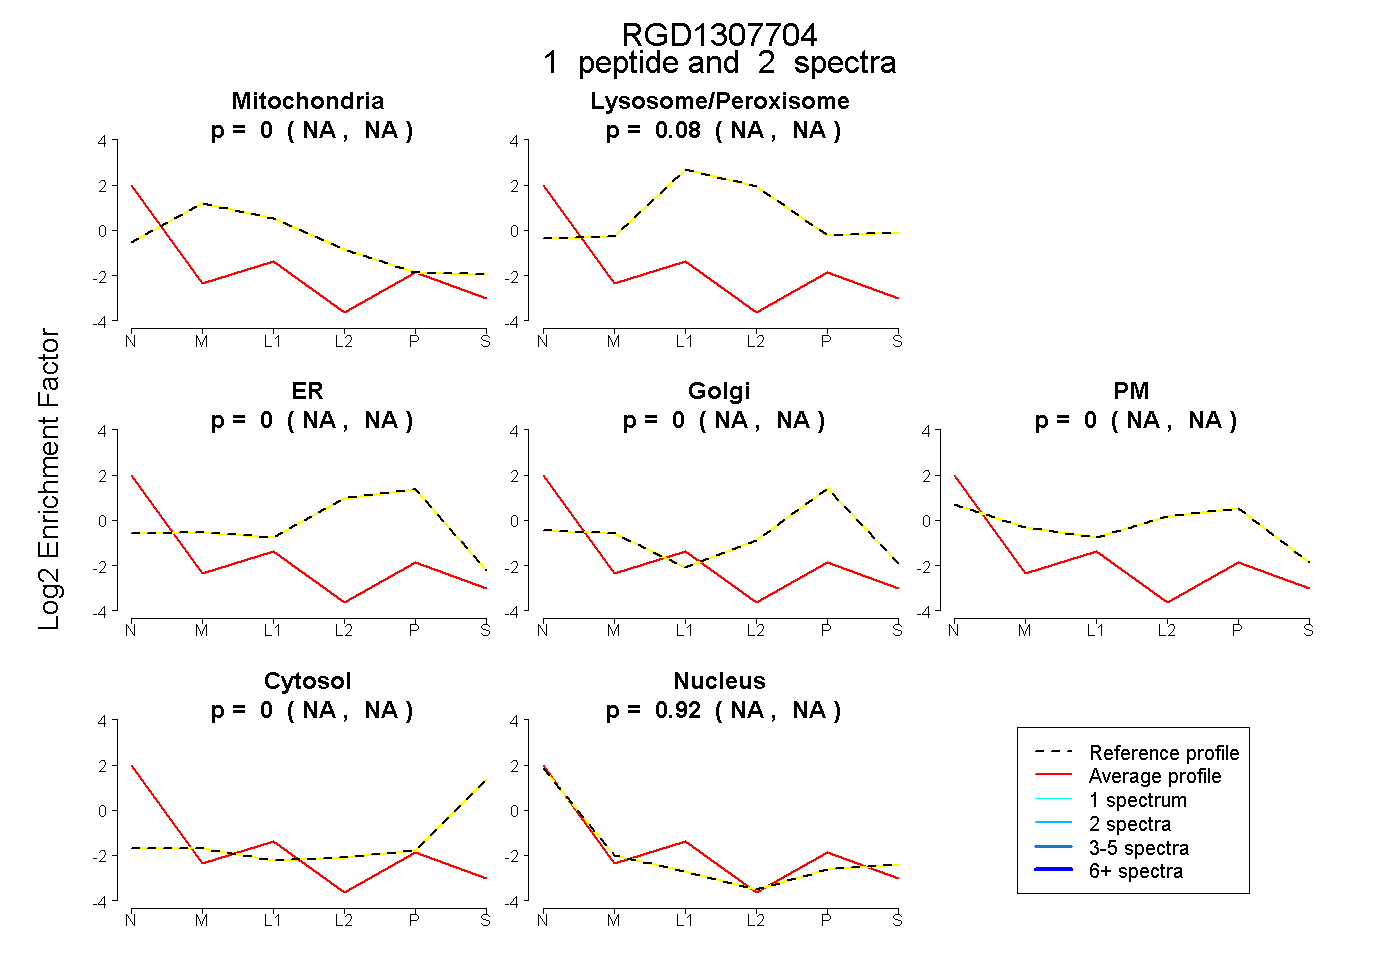 |
0.000 NA | NA |
0.077 NA | NA |
0.000 NA | NA |
0.000 NA | NA |
0.000 NA | NA |
0.000 NA | NA |
0.923 NA | NA |