 2
2peptides
spectra
0.096 | 0.173
0.000 | 0.003
0.000 | 0.000
0.000 | 0.000
0.000 | 0.000
0.000 | 0.000
0.818 | 0.888
0.000 | 0.025
1peptide
spectra
0.000 | 0.000
1.000 | 1.000
| Plot | Mito | Lyso | Perox | ER | Golgi | PM | Cytosol | Nucleus | |||||
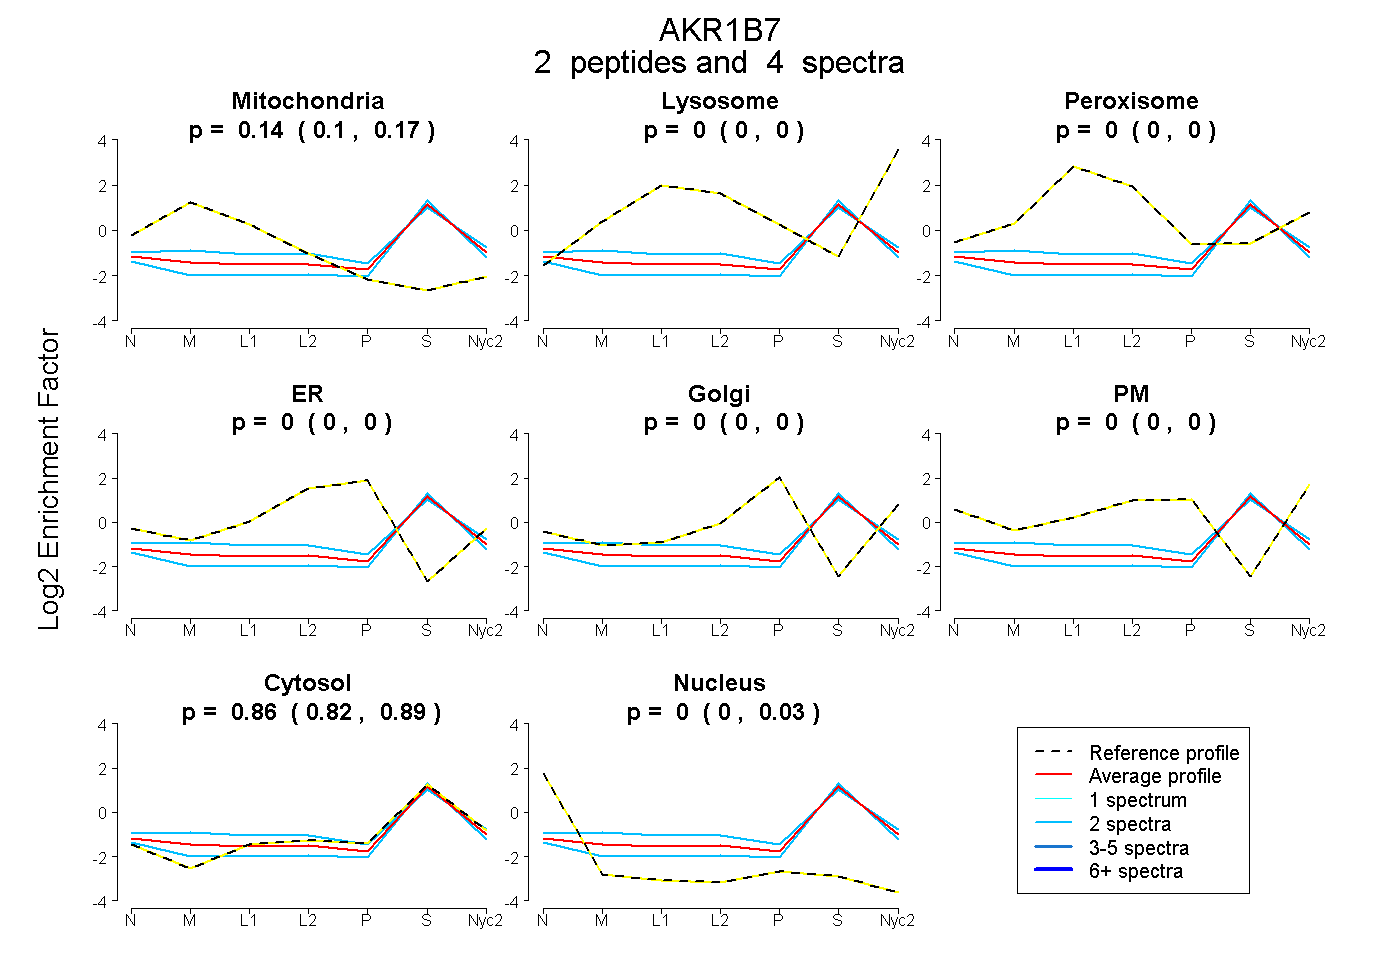
| Expt A |
2 peptides |
4 spectra |
|
0.142 0.096 | 0.173 |
0.000 0.000 | 0.003 |
0.000 0.000 | 0.000 |
0.000 0.000 | 0.000 |
0.000 0.000 | 0.000 |
0.000 0.000 | 0.000 |
0.858 0.818 | 0.888 |
0.000 0.000 | 0.025 |
||
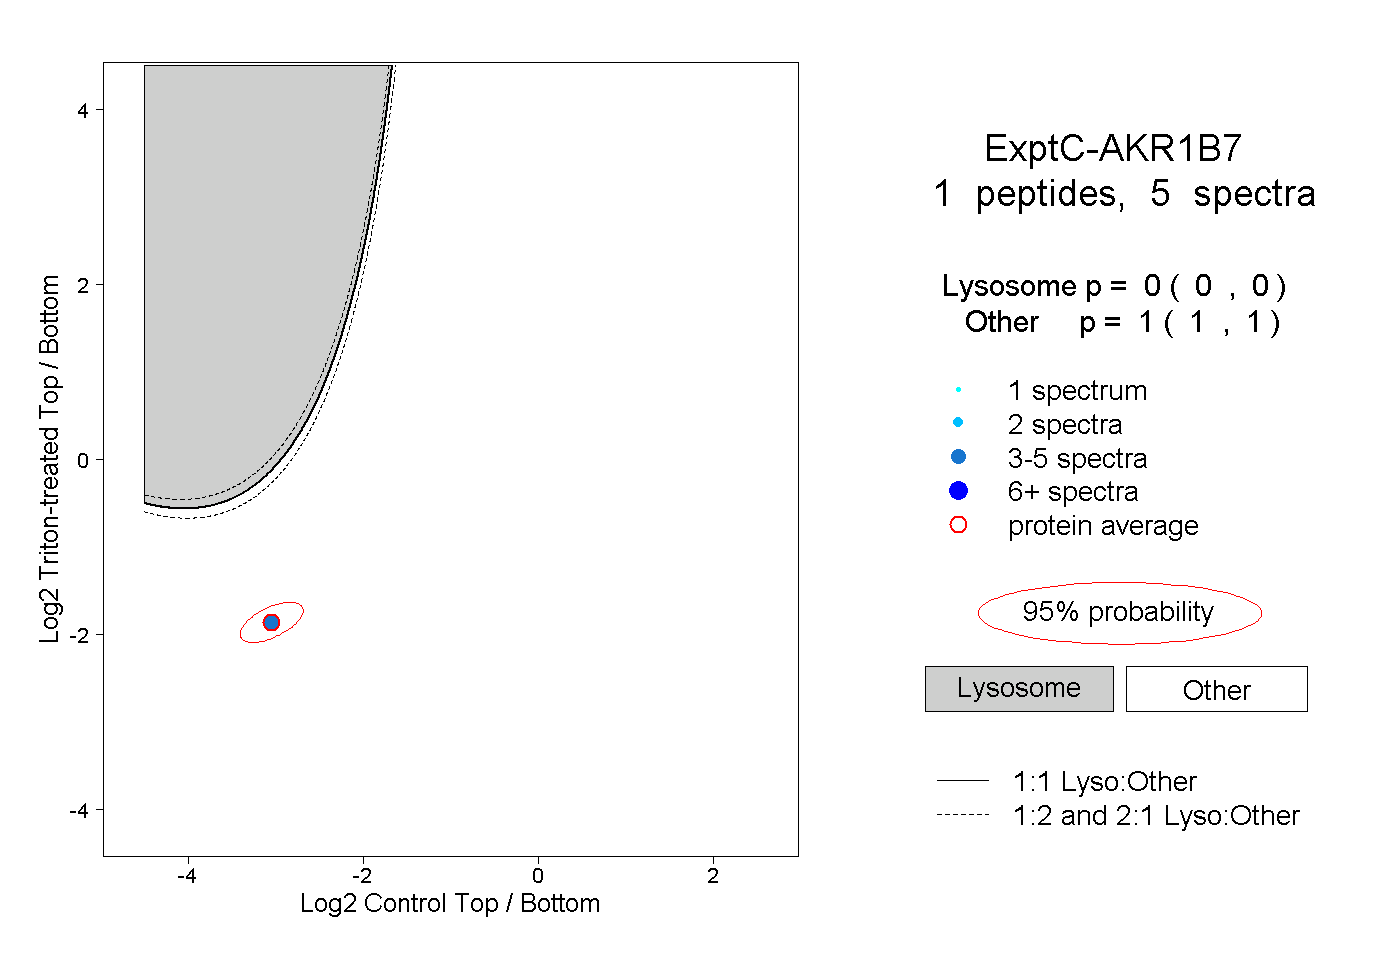
| Plot | Lyso | Other | |||||||||||
| Expt C |
1 peptide |
5 spectra |
|
0.000 0.000 | 0.000 |
1.000 1.000 | 1.000 |